
Wikipedia:Graphics Lab/Map workshop/Archive/Apr 2012
Stale[edit]
Spanish relief map[edit]
-
 Northern Italy map needing relief detail for, plus relief
 -
 Example Spanish map of relief detail/colours required
 -
 The location map which the Spanish map used


Article(s): Various, will be using relief map as base for creating military campaign maps.
Request: Hi, could someone with experience in QGIS software please produce a map of Northern Italy in the same relief quality detail as the Spanish map listed, using the Northern Italy location map for area required, boundaries/rivers, etc. Will be using it to derive a number of military campaign maps, so there is no one article to place it on, I will need to do that myself when I've created those, so SVG would be preferred as I will be using different areas for specific campaigns rather than the entire map all the time, so will need to enlarge/crop places without pixelation or loss of detail. I have given QGIS a serious try out, and spoken to a couple of people on Commons for advice, but to be honest, I was utterly crap at it and ran out of patience after a dozen attempts. Thanks in advance, Ma®©usBritish [chat] 12:04, 21 January 2012 (UTC)
Graphist opinion(s):
Could perhaps this file be usable? Or it might save some work if it is sufficient to modify it to suit your needs. At least I would think relief and topographic would mean the same in this context, or? Commons:Category:Topographic maps of Italy -Laniala (talk) 19:32, 2 February 2012 (UTC)
- Already see this map. It doesn't allow me to selectively derive small areas without pixelating. I need a high-detail SVG. Cheers, Ma®©usBritish[chat] 03:50, 3 February 2012 (UTC)
- Can you specify to what extent you will need to be able to zoom into the map? Reliefs don't usually look good at a wide range of scales: At small scales, they need to be generalised much more than at large scales. Even if it's a vector relief, zooming into a small scale relief would look too smooth, and zooming out of a large scale relief would look too noisy. If you can specify the area of the most zoomed in map, it would be possible to generate a relief of the whole area of interest with the right level of detail.--Tentotwo (talk) 23:57, 6 February 2012 (UTC)
- Hi, thanks for your interest. I have learned how to handle QGIS now.. although it's an annoyingly long, slow, repetitive piece of software, which really needs some work to allow users to handle some of the more mundane tasks, especially when there are a load of SRTM3 tiles to work with. Applying the same properties one tile at a time, rather than to a group of tiles, is awkward. I'll be using shade relief to make the terrain less smooth at small scales, enhanced in Photoshop. I'll take the time to create my own maps, soon as I get a better handling of QGIS. The "zoomed" areas would be equivalent of about 20 sq. miles in some cases, to detail areas of troop concentrations and movements on, from Napoleon's campaign. I'll probably be able to apply the same methods to other campaigns and battles, eventually.. so it's been worth me learning how to do it. But I've found some good data sources for land, water, etc. So given time and patience, I'll manage on my own. Cheers, Ma®©usBritish[chat] 08:12, 9 February 2012 (UTC)
- Can you specify to what extent you will need to be able to zoom into the map? Reliefs don't usually look good at a wide range of scales: At small scales, they need to be generalised much more than at large scales. Even if it's a vector relief, zooming into a small scale relief would look too smooth, and zooming out of a large scale relief would look too noisy. If you can specify the area of the most zoomed in map, it would be possible to generate a relief of the whole area of interest with the right level of detail.--Tentotwo (talk) 23:57, 6 February 2012 (UTC)
Thanks for the tip. I've only figured out how to do simple masks using the RC, from a very brief tutorial.. and the internet is very short of introductory or any decent QGIS tutorials, it seems.. any chance you can give me a clue as to what equations to use to "stitch", or is it simply something like: N40E10 + N40E11 + N40E12 + N41E10 + ... etc, or more involved? Is there an upper limit as to how many tiles it can stitch? I once tried merging a load of tiles and got some kind of "equation too large" error. At the moment I have a lot of SRTM3 tiles covering Italy so it is rastering very slowly, and I would eventually like to cover all Europe and some of Russia in SRTM3 DEMs (?) to help me map a greater area. Perhaps QGIS, or more likely my laptop's integrated Intel HD GFX card, is not designed to handle that much detail and it needs to be broken into smaller projects? Although I could use the PC with its GeForce GFX card if that would help matters. I'm not sure if QGIS is programmed to take advantage of GFX cards, as I read somewhere it doesn't even support multi-core CPUs yet to aid processing, and if that's true, I doubt it supports x64 bit. If you could, please reply on my talkpage, that way it won't get archived like this page and won't appear off-topic. TIA. Cheers, Ma®©usBritish[chat] 03:53, 10 February 2012 (UTC)
Template:Currency signs[edit]
Article(s): Template:Currency signs
Request: Can it be made more crispy? I think contrasts (visibility) could be better. DePiep (talk) 22:04, 27 January 2012 (UTC)
Graphist opinion(s):
[edit]
-
 Blank map

Article(s): Naval Criminal Investigative Service
Request: Create a map of worldwide Naval Criminal Investigative Service locations. A basic map is available on the NCIS website here. If you wish to be more accurate from the get-go, each of the 14 locations has an individual page below the map with their physical address listed. NCIS has many more offices under the 14 major offices, however, I think that listing the 14 major field offices is good for now.
Recommend uploading the finished map to http://commons.wikimedia.org/wiki/File:Naval_Criminal_Investigative_Service_locations.svg Evan.oltmanns (talk) 03:34, 3 February 2012 (UTC)
Graphist opinion(s):
![]() Request taken by Orionist.
Request taken by Orionist.
Metropolitan Toronto[edit]
Article(s): Metropolitan Toronto and its former constituents
Request: The Municipality of Metropolitan Toronto ("Metro Toronto") existed from 1954 until 1997. It consisted originally of 13 member municipalities, of which 7 were eliminated in 1967 by merging them into their larger neighbors. I think, but cannot confirm, that there was exactly one change to the outer boundary of Metro Toronto during its existence, annexing a small section of Pickering. I believe that the article on Metro Toronto should have maps showing both the initial and final configurations, with the names of the 13 and the remaining 6 members. Alternatively, the two maps could be combined as one (e.g. using thin lines for the boundaries eliminated in 1967), and the Pickering boundary change might also be shown on the same map.
There is an existing map in Wikipedia, File:Toronto_map.png, that shows the boundaries as they were in the era of 6 member municipalities. So this is part of what I'm asking for, but it labels things from a present-day perspective rather than a Metro-era perspective. In particular, what was then simply Toronto (in full, the City of Toronto) is labeled as "Old Toronto", and an inset shows the map in the context of a "Greater Toronto Area", a term barely coming into use at the end of the Metro era.
Currently, variations of this map are placed in some but not all of the articles for former member municipalities of Metro. For example, East York shows it with post-1967 East York (including the former Leaside) in red; Leaside shows it with pre-1967 Leaside in red; Mimico does not use it at all. Because of the use of "Old Toronto", this map is actually anachronistic in these articles.
If the map or maps I'm asking for were created, it/they could be used to derive maps for all of the former municipalities, in particular including the ones that were eliminated in 1967.
65.92.0.140 (talk) 07:41, 8 February 2012 (UTC)
Graphist opinion(s):
Batavia in 1740[edit]
Article(s): 1740 Batavia massacre
Request: If I were to post a map of Batavia (Jakarta) in 1740 from a book, could someone here do an SVG version? The map is under copyright so it cannot be used as-is. Crisco 1492 (talk) 06:38, 9 February 2012 (UTC)
Graphist opinion(s):
Hawaii hotspot[edit]
-
 North Pacific Ocean

Article(s): Hawaii hotspot, List of volcanoes in the Hawaiian-Emperor seamount chain, Hawaiian-Emperor seamount chain
Request: A tighter crop around the actual hotspot trail, which is the bulge heading off from Hawaii in the center of the image; but not too aggressive as I want to keep locational context. Thanks, ResMar 19:48, 11 February 2012 (UTC)
Graphist opinion(s):
Location map of the USSR[edit]
-
 Current location map of Russia

Article(s): A-135 anti-ballistic missile system, Daryal radar, Voronezh radar, others.
Request: We really don't seem to have a USSR map that works with location map. I want to plot Soviet/Russian early warning radars to demonstrate their geographical spread on the periphery of the USSR, and hence that most are now outside the Russian Federation. I can see that it would be useful for others too. Secretlondon (talk) 21:11, 13 February 2012 (UTC)
Graphist opinion(s):
topographic map of Batna[edit]
Article(s): Batna, Algeria, Belezma National Park, Batna, and many other.
Request: (Source ) I ask if you could making the image that is above, a topographic map of Batna in SVG, thank you all Vikoula5 (talk) 00:15, 21 October 2011 ::
Graphist opinion(s):
Shaded topographics are hard to do in SVG; would a jpeg work for you? Keithpickering (talk) 00:31, 14 February 2012 (UTC)
Another reply This is an svg of the park: http://upload.wikimedia.org/wikipedia/commons/5/5a/Carte_de_zonage_du_Parc_national_de_Belezma.svg. I don't think it's topographic though.GalenaMcGregor (talk) 05:20, 24 February 2012 (UTC)
China X location map[edit]
-
 The location map to be used as a pushpin for places within Chongqing Municipality, PRC.

Potential source(s): See the above image. Be wary when making the map for Anhui, though.
Articles: For example, the map [[File:China Gansu location map.svg]] can be used in the infoboxes of articles that transcribe {{Gansu-geo-stub}}.
Request: Create similar location maps for the remaining Chinese provinces (including the other three municipalities); Henan and Shanxi (i.e. 山西) are the least of our worries since there exist {{Location map China Henan}} and {{Location map China Shanxi}}. In terms of timing, I am not too picky, but please do not leave WP:CHINA waiting 5 months for a single map, as the last location map was uploaded in September. GotR Talk 19:05, 27 February 2012 (UTC)
Graphist opinion(s):
a blank world map in svg with the european Union striped?[edit]
-
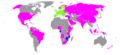
 the image now used at ACTA
 -
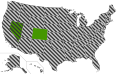 A striped version for the US as example
 -
 similar map with similar problems (now in svg, but I could redraw in svg if I had the striped template...)
.svg)


Article(s): for use on ACTA, but the blank version also for use on Cape Town Treaty
Request: The European Union has several mixed treaties: treaties in which both the European Union and its 27 member states are party. Furthermore, there are several multilateral conventions to which both the EU and its members are/may become parties. This easily leads to complicated maps. For example the ACTA map would (in absence of the EU-things) have only two colours: those countries that signed (pink) and those that may sign (blue). Now it has two more: countries covered by the signature of the EU (orange) and countries covered by that signature, which also signed themselves (green). As an alternative I'd like to have the European Union striped on an svg map, so that we can put country signatures in 1 coulour (whether in EU or not). Could someone make such a blank map (I could add the country colouring myself)?
NB: the US map is given as an example. However in this case, I'd prefer the stripes to be continuous (not to have a visible different striping pattern at country borders), and maybe a thinner line/more whitespace. Thanks! L.tak (talk) 18:18, 28 February 2012 (UTC)
Graphist opinion(s):
Resolved[edit]
Sweden/Norway[edit]


Article(s): Union between Sweden and Norway
Request: Redraw as SVG and make it 6 times larger.
Graphist opinion(s):![]() Done Slightly different proportions, but I hope it's good enough - ArnoldPlaton (talk) 16:58, 5 April 2012 (UTC)
Done Slightly different proportions, but I hope it's good enough - ArnoldPlaton (talk) 16:58, 5 April 2012 (UTC)
Barotseland[edit]
-

-
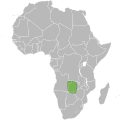 Svg version


Article(s):
Request: Redraw as SVG.
Graphist opinion(s):![]() Done The .jpg version was a bit confusing as It made Barotseland look as a country on its own. So I used a trasparent layer over the current political boundaries to express Barotseland - ArnoldPlaton (talk) 18:00, 5 April 2012 (UTC)
Done The .jpg version was a bit confusing as It made Barotseland look as a country on its own. So I used a trasparent layer over the current political boundaries to express Barotseland - ArnoldPlaton (talk) 18:00, 5 April 2012 (UTC)
Indiana map vectorisation[edit]
-
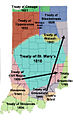 Note the erroneous spelling of "Tippecanoe"
 -
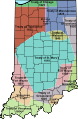


Article(s): Indian removals in Indiana, twelve others
Request: Could this be vectorised? If you do it, please note the misspelling. Nyttend (talk) 05:09, 29 January 2012 (UTC)
Graphist opinion(s):![]() Done - ArnoldPlaton (talk) 16:24, 5 April 2012 (UTC)
Done - ArnoldPlaton (talk) 16:24, 5 April 2012 (UTC)
Names of towns on map of Azawad[edit]
-
-
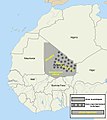
 Old file
 -
 New file
 -
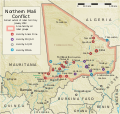
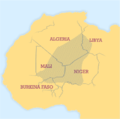 Contradictory map


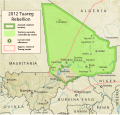
Article(s): Tuareg Rebellion (2011–present)
Request: Put names on the map of Azawad to illustrate where the fighting in the Tuareg Rebellion (2011–present) is happening. Perhaps an illustration of the entirety of Tuareg lands as well, though that might confuse the fact that the fighting is currently only taking place in Mali. Thirdly, this map> http://en.wikipedia.org/wiki/File:Tuareg_area.png gives a different extent of Tuareg lands within Mali. Perhaps someone could clarify the matter? 86.41.38.98 (talk) 03:04, 8 February 2012 (UTC)
- Just an updated request, can we change tht map to indicate the whole Malian Azawad as most sources indicate.
- I undid the done tag just to try and get this done.Lihaas (talk) 08:29, 21 February 2012 (UTC)
- Woops, my bad. forget to include the contradictory map. As you can see map 1 and 3 contradict each other. need to have the 2 maps on the same area...either 3 maches 1 OR 1 maches 3Lihaas (talk) 05:09, 29 February 2012 (UTC)
- The reason for varying depictions of the extent of Tuareg settlement is because these areas are among the harshest in the Sahara desert, meaning sparse population density and that most of the inhabitants are nomads (and thus difficult to get reliable census data on). I don't think the contradiction is too much of a problem, because there's no objective accuracy that we could obtain in any case. --Μετάknowledgediscuss/deeds 21:31, 1 April 2012 (UTC)
- Woops, my bad. forget to include the contradictory map. As you can see map 1 and 3 contradict each other. need to have the 2 maps on the same area...either 3 maches 1 OR 1 maches 3Lihaas (talk) 05:09, 29 February 2012 (UTC)
- I undid the done tag just to try and get this done.Lihaas (talk) 08:29, 21 February 2012 (UTC)
- Just an updated request, can we change tht map to indicate the whole Malian Azawad as most sources indicate.
Graphist opinion(s):
![]() Request taken by Orionist.
Request taken by Orionist.
Graphist opinion(s):
![]() Request taken by Wigiz.
Request taken by Wigiz.
 Done - my account is under 4 days old - if someone could just overwrite the old with the new, thanks. Wigiz (talk) 10:52, 4 April 2012 (UTC)
Horseshoe Curve (Pennsylvania)[edit]
Source
[[1]]
Data Source - USGS GNIS FID: 1177462
Article(s): Horseshoe Curve (Pennsylvania)
Request: I request a terrain map for the Horseshoe Curve (Pennsylvania) article, showing the route of the railroad from downtown Altoona, Pennsylvania westward to the area of Gallitzin, Pennsylvania. The map should aid the reader in understanding why the Horseshoe curve was needed for the Pennsylvania Railroad railroad to efficiently go from Altoona to Pittsburgh in 1854, and for the Norfolk Southern to do so today. DThomsen8 (talk) 22:13, 25 February 2012 (UTC)
Graphist opinion: I'll take it. My plan is shaded relief (rather than contour lines), omitting roads, but including the rail line. Keithpickering (talk) 07:33, 1 March 2012 (UTC)


Take a look at this and see what you think. Keithpickering (talk) 19:15, 1 March 2012 (UTC)
Not having heard back, I'm calling this "done" at this point, and have included the map in the article. If you want changes, let me know and I can update the map. Keithpickering (talk) 20:21, 3 March 2012 (UTC)
![]() Done
Done
Kingdom of Huahine map[edit]

Article(s): Huahine, List of monarchs of Huahine
Request: Please create a map of the kingdom consisting of the islands of Huahine and Maiao... --KAVEBEAR (talk) 08:57, 28 January 2012 (UTC)
Graphist opinion(s): Request at the Map Workshop
- Done Is this good? (see above) -ArnoldPlaton (talk) 10:07, 6 April 2012 (UTC)
North Dakota Highway 22[edit]
-
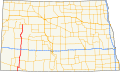
 a map of North Dakota highways to use as a base map
 -
 File:North Dakota Highway 22.svg


Article(s): North Dakota Highway 22
Request: Change base map to show highway 22 as red. D O N D E groovily Talk to me 02:02, 2 March 2012 (UTC)
Graphist opinion:
![]() Done ―― Phoenix7777 (talk) 09:11, 2 March 2012 (UTC)
Done ―― Phoenix7777 (talk) 09:11, 2 March 2012 (UTC)
Same-sex marriage map Europe detailed.svg[edit]
-
 Same sex marriage laws in Europe

Article(s): multiple
Request: A Slovenian referendum (Slovenian Family Code referendum, 2012) rejected recognition, we need to change the colour there. Lihaas (talk) 13:31, 26 March 2012 (UTC)
Graphist opinion(s):
![]() Done — Ma®©usBritish[chat] 14:52, 27 March 2012 (UTC)
Done — Ma®©usBritish[chat] 14:52, 27 March 2012 (UTC)