1912 United States presidential election in Maryland
| |||||||||||||||||||||||||||||||||
| |||||||||||||||||||||||||||||||||
 County Results
| |||||||||||||||||||||||||||||||||
| |||||||||||||||||||||||||||||||||
| Elections in Maryland |
|---|
 |
|
|
The 1912 United States presidential election in Maryland took place on November 5, 1912, as part of the 1912 United States presidential election. State voters chose eight representatives, or electors, to the Electoral College, who voted for president and vice president.
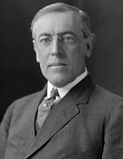
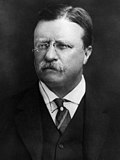
Maryland was won by Princeton University President Woodrow Wilson (D–New Jersey), running with governor of Indiana Thomas R. Marshall, with 48.57% of the popular vote, against the 26th president of the United States Theodore Roosevelt (P–New York), running with governor of California Hiram Johnson, with 24.91% of the popular vote and the 27th president of the United States William Howard Taft (R–Ohio), running with Columbia University President Nicholas Murray Butler, with 23.69% of the popular vote.[1] As of the 2020 presidential election[update], this is the first and only time that Garrett County did not support the Republican candidate.[2] As of 2020, this is also the last time the Democratic candidate won Carroll County by more than 10%.[3]
This was the first time since 1892 that a Democrat won the popular vote in Maryland.
Results
[edit]| Party | Candidate | Votes | % | |
|---|---|---|---|---|
| Democratic | Woodrow Wilson | 112,674 | 48.57% | |
| Progressive | Theodore Roosevelt | 57,789 | 24.91% | |
| Republican | William Howard Taft (incumbent) | 54,956 | 23.69% | |
| Socialist | Eugene V. Debs | 3,996 | 1.72% | |
| Prohibition | Eugene W. Chafin | 2,244 | 0.97% | |
| Socialist Labor | Arthur Reimer | 322 | 0.14% | |
| Total votes | 231,981 | 100% | ||
Results by county
[edit]| County | Thomas Woodrow Wilson Democratic |
William Howard Taft Republican |
Theodore Roosevelt Progressive "Bull Moose" |
Various candidates Other parties |
Margin[a] | Total votes cast[4] | |||||
|---|---|---|---|---|---|---|---|---|---|---|---|
| # | % | # | % | # | % | # | % | # | % | ||
| Allegany | 3,382 | 39.36% | 1,396 | 16.25% | 2,631 | 30.62% | 1,184 | 13.78% | 751 | 8.74% | 8,593 |
| Anne Arundel | 3,049 | 46.10% | 2,222 | 33.60% | 794 | 12.00% | 549 | 8.30% | 827[b] | 12.50% | 6,614 |
| Baltimore | 11,524 | 51.65% | 4,247 | 19.03% | 6,211 | 27.84% | 330 | 1.48% | 5,313 | 23.81% | 22,312 |
| Baltimore City | 48,030 | 48.36% | 15,597 | 15.70% | 33,679 | 33.91% | 2,016 | 2.03% | 14,351 | 14.45% | 99,322 |
| Calvert | 616 | 34.74% | 1,035 | 58.38% | 83 | 4.68% | 39 | 2.20% | -419[b] | -23.63% | 1,773 |
| Caroline | 1,882 | 51.63% | 1,445 | 39.64% | 196 | 5.38% | 122 | 3.35% | 437[b] | 11.99% | 3,645 |
| Carroll | 3,616 | 50.11% | 2,546 | 35.28% | 923 | 12.79% | 131 | 1.82% | 1,070[b] | 14.83% | 7,216 |
| Cecil | 2,491 | 52.60% | 1,509 | 31.86% | 646 | 13.64% | 90 | 1.90% | 982[b] | 20.73% | 4,736 |
| Charles | 918 | 34.69% | 1,573 | 59.45% | 113 | 4.27% | 42 | 1.59% | -655[b] | -24.75% | 2,646 |
| Dorchester | 2,509 | 47.08% | 2,387 | 44.79% | 313 | 5.87% | 120 | 2.25% | 122[b] | 2.29% | 5,329 |
| Frederick | 5,545 | 48.81% | 2,813 | 24.76% | 2,776 | 24.44% | 226 | 1.99% | 2,732[b] | 24.05% | 11,360 |
| Garrett | 1,005 | 34.42% | 655 | 22.43% | 1,069 | 36.61% | 191 | 6.54% | -64 | -2.19% | 2,920 |
| Harford | 3,064 | 53.63% | 1,737 | 30.40% | 802 | 14.04% | 110 | 1.93% | 1,327[b] | 23.23% | 5,713 |
| Howard | 1,523 | 51.45% | 1,004 | 33.92% | 364 | 12.30% | 69 | 2.33% | 519[b] | 17.53% | 2,960 |
| Kent | 1,816 | 53.73% | 1,021 | 30.21% | 463 | 13.70% | 80 | 2.37% | 795[b] | 23.52% | 3,380 |
| Montgomery | 3,501 | 56.10% | 1,675 | 26.84% | 884 | 14.16% | 181 | 2.90% | 1,826[b] | 29.26% | 6,241 |
| Prince George's | 2,424 | 45.38% | 1,456 | 27.26% | 1,308 | 24.49% | 153 | 2.86% | 968[b] | 18.12% | 5,341 |
| Queen Anne's | 1,902 | 55.52% | 1,311 | 38.27% | 119 | 3.47% | 94 | 2.74% | 591[b] | 17.25% | 3,426 |
| Somerset[c] | 843 | 36.09% | 1,262 | 54.02% | 144 | 6.16% | 87 | 3.72% | -419[b] | -17.94% | 2,336 |
| St. Mary's[c] | 1,617 | 45.51% | 1,528 | 43.01% | 370 | 10.41% | 38 | 1.07% | 89[b] | 2.50% | 3,553 |
| Talbot | 1,888 | 47.13% | 1,835 | 45.81% | 190 | 4.74% | 93 | 2.32% | 53[b] | 1.32% | 4,006 |
| Washington | 4,589 | 48.10% | 1,907 | 19.99% | 2,606 | 27.32% | 438 | 4.59% | 1,983 | 20.79% | 9,540 |
| Wicomico | 3,176 | 55.02% | 2,038 | 35.31% | 442 | 7.66% | 116 | 2.01% | 1,138[b] | 19.72% | 5,772 |
| Worcester | 1,764 | 54.33% | 757 | 23.31% | 663 | 20.42% | 63 | 1.94% | 1,007[b] | 31.01% | 3,247 |
| Totals | 112,674 | 48.57% | 54,956 | 23.69% | 57,789 | 24.91% | 6,562 | 2.83% | 54,885 | 23.66% | 231,981 |
Counties that flipped from Republican to Democratic
[edit]Counties that flipped from Republican to Progressive
[edit]See also
[edit]- United States presidential elections in Maryland
- 1912 United States presidential election
- 1912 United States elections
Notes
[edit]- ^ Because Roosevelt finished ahead of Taft in Maryland as a whole, all margins give are Wilson minus Roosevelt unless stated in the total for the county in question.
- ^ a b c d e f g h i j k l m n o p q r s In this county where Taft did run second ahead of Roosevelt, the margin given is that between Wilson and Taft.
- ^ a b Figures for Somerset and St. Mary’s Counties given both in Géoelections and in David Leip’s presidential election data have the counties reversed vis-à-vis the accompanying maps. The figures given here are based on the accompanying maps as these appear most likely given the results for these counties in adjacent “System of 1896” elections
References
[edit]- ^ a b "1912 Presidential Election Results Maryland".
- ^ Sullivan, Robert David; ‘How the Red and Blue Map Evolved Over the Past Century’; America Magazine in The National Catholic Review; June 29, 2016
- ^ "Maryland". Google Docs. Retrieved August 28, 2022.
- ^ Maryland State Board of Elections; Maryland Manual 1912-1913 pp. 249-254


