1973 Cornwall County Council election
Appearance
| |||||||||||||||||||||||||
All 79 seats of Cornwall County Council 40 seats needed for a majority | |||||||||||||||||||||||||
|---|---|---|---|---|---|---|---|---|---|---|---|---|---|---|---|---|---|---|---|---|---|---|---|---|---|
| |||||||||||||||||||||||||
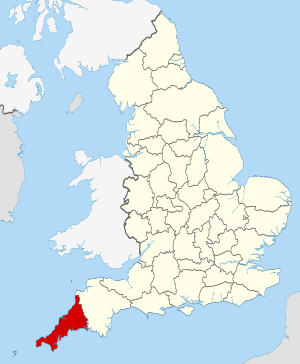
 The County of Cornwall within England | |||||||||||||||||||||||||
| |||||||||||||||||||||||||
Elections to Cornwall County Council were held on 12 April 1973. This was on the same day as other UK county council elections. The whole council of 79 members was up for election and the council fell under the control of Independents.
Results summary
[edit]| Party | Seats | Gains | Losses | Net gain/loss | Seats % | Votes % | Votes | +/− | |
|---|---|---|---|---|---|---|---|---|---|
| Independent | 71 | 89.9 | 86.9 | 54,611 | |||||
| Conservative | 5 | 6.3 | 5.2 | 3,300 | |||||
| Labour | 3 | 3.8 | 7.5 | 4,727 | |||||
| Liberal | 0 | 0.0 | 0.4 | 232 | |||||
References
[edit]- ^ a b "Local Election Summaries 1973". The Elections Centre. Retrieved 21 June 2019.
