
Talk:Crossing the Chasm/Archives/2012
| This page is an archive of past discussions. Do not edit the contents of this page. If you wish to start a new discussion or revive an old one, please do so on the current talk page. |
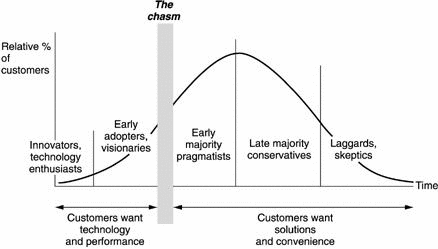
An illustration could go a long way.
I'm just thinking is it too bad if someone illustrated the life cycle of the market as Moore sees it together with the location of the chasms.
- I am working on one Natebailey 00:22, 1 July 2007 (UTC)
- I believe the illustration does not correspond to the one used in the book. Just check the book cover and you will notice. --189.122.15.94 (talk) 01:04, 27 May 2010 (UTC)
- I am working on one Natebailey 00:22, 1 July 2007 (UTC)
- Agree. The better ones are http://www.codeodor.com/images/crossing_the_chasm.png and http://sgentrepreneurs.com/wordpress/wp-content/uploads/2006/06/chasm.gif But they are not mine. Can we just copy it here? (Wisnuops (talk) 05:22, 30 June 2010 (UTC))
Looking at my first edition paper copy of the book, the illustration in the article indeed doesn't match. I've written to the book's author to confirm that he hasn't revised the model at some point, and to ask if he has an illustration that he could give us permission to use. I'll update here if I hear back. -- William Pietri (talk) 00:51, 15 February 2011 (UTC)
I have taken out the illustration as it is showing the chasm in the WRONG PLACE, so is more harmful than no illustration at all. — Preceding unsigned comment added by 80.189.129.69 (talk) 13:19, 2 October 2011 (UTC)
Unsubstantiated assertions
The article as it currently stands makes a number of unsubstantiated assertions. Does anyone know of published research (journals, books, web sites) that have analysed these issues and provide substantial support for them? (statistics, references, etc.) Natebailey 00:22, 1 July 2007 (UTC)
It looks to me like the first reference ("Confusion between continuous and discontinuous innovation is a leading cause of failure for high tech products") is substantiated by at least three (3) published articles: 1. conference proceedings at the University of Washington, 2. web site that documents the results of a 10-year study, and 3. conference proceedings organized by the Washington Software Association. The same sources apply to one of the links removed under "see also."
The link to "Psychographic Profiles" is also substantiated as follows: "Abstracted from the North Central Rural Sociology Committee, Subcommittee for the Study of the Diffusion of Farm Practices. The Diffusion Process. Ames: Agriculture Extension Service, Iowa State College, Special Report No. 18, 1957" which appears in the 2nd paragraph of the linked page.Quietleader 06:09, 5 July 2007 (UTC)
Here is a possible supporting reference for the statement regarding the first-mover advantage ("there is substantial evidence that being a later mover in a given technology market may also be advantageous"). see: Fast_SecondQuietleader 06:22, 5 July 2007 (UTC)
- I've read the "Top 10 mistakes" article, but it doesn't seem to actually support the argument (ie. it provides no data, either through case studies or statistics to substantiate that this is a valid assertion). What we need is an article or study that shows some high tech products that have failed because of this confusion, but I'm not aware of any such study -- do you know of any? (eg. the "10-year study" you mention above - I can't see it referenced here?).
- The psychographic profiles article doesn't seem to be referenced in the text anywhere, or have any direct relevance to the article?
- Fast Second looks like a good possibility -- we may need to flesh that article out a bit to show that it does actually demonstrate how those companies have used "second mover advantage". Natebailey 03:03, 7 July 2007 (UTC)
I think information you are looking for may be impossible to collect because the nature of the question being asked (what are the the leading causes of failure in high-tech) is inherently qualitative rather than quantitative.
In the world of business, failure in the marketplace can rarely be attributed to just one cause. Failure is typically caused by a combination of factors and it's not realistic to expect a person to assign precise numbers to each contributing factor.
Imagine asking 500 CEOs or industry analysts why a high-tech product failed. The result will be a simple list of factors that lead to failure, not a quantitative weighting of factors. (Who would believe a CEO that said 42% of our product's failure can be attributed to using the wrong sales channel)
Because the nature of this area of inquiry is multi-variable and qualitative (which is perception based and therefore subjective), it's doubtful that meaningful statistics could ever be collected.
It appears to me that the "Top 10 Mistakes" article is the result of a qualitative study where "patterns of response" are reported. And the response "we didn't realize our product was a continuous innovation, not discontinuous" was mentioned frequently enough, along with other factors, to be labeled as a top-10 reason. I'm not sure that exact quantitative data is attainable.Quietleader 21:51, 8 July 2007 (UTC)
- I'd be quite happy with any data in the vein you suggest above. Even an article that interviewed 10 CEOs of Fortune 500 companies where they all agreed that a misunderstanding of continuous innovation was a major factor in product failure would provide some reasonable substantiation for the concept. If required, a statistical study could be derived from the number of CEOs who put this issue in their top 10 mistakes, for example.
- The "Top 10" article doesn't seem to reference any study at all? (eg. who conducted the study, who were the participants (company, quantity, type, etc.), how were they surveyed, what were the major findings, etc.?). Essentially, it doesn't describe the context of how the data were collected and analysed, and how the results were found. Natebailey 07:33, 11 July 2007 (UTC)
Fair use rationale for Image:Chossing-the-chasm-cover.jpg

Image:Chossing-the-chasm-cover.jpg is being used on this article. I notice the image page specifies that the image is being used under fair use but there is no explanation or rationale as to why its use in this Wikipedia article constitutes fair use. In addition to the boilerplate fair use template, you must also write out on the image description page a specific explanation or rationale for why using this image in each article is consistent with fair use.
Please go to the image description page and edit it to include a fair use rationale. Using one of the templates at Wikipedia:Fair use rationale guideline is an easy way to insure that your image is in compliance with Wikipedia policy, but remember that you must complete the template. Do not simply insert a blank template on an image page.
If there is other fair use media, consider checking that you have specified the fair use rationale on the other images used on this page. Note that any fair use images lacking such an explanation can be deleted one week after being tagged, as described on criteria for speedy deletion. If you have any questions please ask them at the Media copyright questions page. Thank you.