
Talk:HadCRUT
| Find sources: Google (books · news · scholar · free images · WP refs) · FENS · JSTOR · TWL |
| This article is rated Start-class on Wikipedia's content assessment scale. It is of interest to the following WikiProjects: | ||||||||||||||
| ||||||||||||||


I brought the History Section here, over from the wiki entry on Climategate. Clearly the FOI and ICO stuff is not really related to the hacked emails. The entire bunch of "info" should be cut down to 1 or 2 paragraphs. Gise-354x (talk) 03:40, 18 August 2011 (UTC)
- There are significant parts of this article that are irrelevant to the HadCRUT dataset (e.g. FOI requests for emails related to IPCC). However I'd prefer not to edit this page in case of possible perceived COI (since I am the Tim Osborn who is from the Climatic Research Unit). Best if someone else sorts this out, keeping only material that is (a) related directly to HadCRUT and (b) notable. TimOsborn (talk) 12:15, 29 September 2011 (UTC)
- Very true, I've been trying to sort out an improvement on this by moving the detail, including detail about IPCC discussions rather than data, to a new article: have now started Freedom of Information requests to the Climatic Research Unit and trimmed this article to something more appropriate. . dave souza, talk 14:53, 29 September 2011 (UTC)
I reverted the recent change about the reason for recent cooling. It was poorly defined (what period? how much cooling is there when considering the uncertainty ranges?) and too confident ("is predominantly due to": well, given limited data coverage in some of the regions mentioned, it is not certain how much they have really warmed, and therefore not certain of the size of any bias in HadCRUT4 because it is missing those regions). This issue should be covered, but better sourced and more precisely explained. The context (i.e. the slowdown in surface warming) should be given too. TimOsborn (talk) 12:38, 24 July 2014 (UTC)
- Tim, you only had HadCRUT4 data up to 2014. My graph http://clim8.stanford.edu/ClimCO2to2020.jpg shows the Keeling Curve up to 2022 superimposed on HadCRUT4 for the same period.
- It seems clear to me that 2000-2012 is relatively flat compared to 1975-2000 and 2012-2022. However unlike 1945-1975 and 1880-1910, nowhere is there a significant decline like those declines anywhere in 1975-2022.
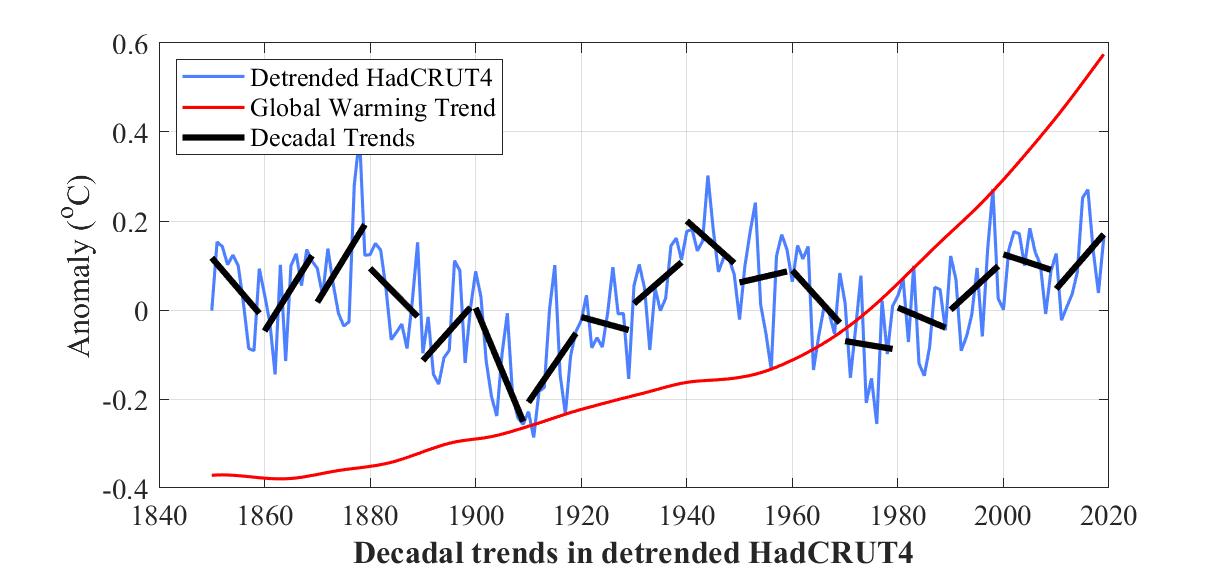
- I do have an explanation for the flatness, based on the 17 short black trendlines in the plot http://clim8.stanford.edu/DecadalTrends.jpg of detrended HadCRUT4, namely HadCRUT4 less the red curve representing the expected contribution of rising CO2 defined as log(CO2/330) to a suitable base. It seems to me that these bear out Edward P. Ney's cosmic ray theory of 1959, https://www.nature.com/articles/183451a0, Cosmic Radiation and the Weather. Via a mechanism I don't yet understand, one polarity of the 21-year Hale cycle may be allowing more cosmic rays to create clouds than the other. From 1870 to now, the "even" decades are pushed down, and the even decade 200x was no exception; however it was not pushed down as much as previous even decades (in the undetrended case) because CO2 was rising faster than ever. In the detrended case it doesdecline. Vaughan Pratt (talk) 23:16, 12 October 2023 (UTC)