This article is within the scope of WikiProject Climate change, a collaborative effort to improve the coverage of Climate change on Wikipedia. If you would like to participate, please visit the project page, where you can join the discussion and see a list of open tasks.Climate changeWikipedia:WikiProject Climate changeTemplate:WikiProject Climate changeClimate change
This article is within the scope of WikiProject Oceans, a collaborative effort to improve the coverage of oceans, seas, and bays on Wikipedia. If you would like to participate, please visit the project page, where you can join the discussion and see a list of open tasks.OceansWikipedia:WikiProject OceansTemplate:WikiProject OceansOceans
Other : add ISBNs and remove excessive or inappropriate external links from Aral Sea; check La Belle (ship) for GA status; improve citations or footnotes and remove excessive or inappropriate external links from MS Estonia
I've just done some updating, rearranging and copy editing for this article. It seems that some of the sentences that were added last year by others and sourced to the IPCC AR 6 report might have copyright issues. As a quick fix, I have put them in quotation marks. I couldn't think of fast and easy ways to say the same "in my own words" especially when it's e.g. just expected temperature increases for different emissions scenarios. Pinging @Femke as I know they feel strongly about this issue and perhaps they have some good suggestions. EMsmile (talk) 15:09, 20 March 2023 (UTC)[reply]
I also want to ping @Epipelagic as a person with lots of knowledge on marine topics: Are there any important aspects missing for this article at this stage, and is it sufficiently well linked with other related articles, e.g. coral bleaching but also the effects of such marine heatwaves on other marine ecosystems? Does anything jump at you at needing further work (but without creating overlap with other articles)? EMsmile (talk) 15:09, 20 March 2023 (UTC)[reply]
@EMsmile: can you figure out with copyright-savvy people if this is a copyvio problem before introducing this in more places? In general, you really need to learn to write prose in your own words. —Femke 🐦 (talk) 17:25, 20 March 2023 (UTC)[reply]
I am finding your second sentence quite condescending. Last time I checked, Wikipedia was still a collaborative space where everyone contributes according to their strength and their personal interest (within the confines of the rules and guidelines of course) and then we build onto each other's work. So if you are very good at converting sentences from the academic literature into prose quickly then that's great. I find it hard (and time consuming) especially a sentence like this (which has probably been through many iterations in the process to get it just right): "marine heatwaves will very likely further increase in frequency, duration, spatial extent and intensity" and I honestly think that a few quotes from an IPCC report won't "break" an article and can actually be justified. We might have different visions for Wikipedia articles on climate change topics here.
Which of my edits from today exactly do you object to now? I came to this article with the intention of spending 2 hours on it to make it better. Do you not think that my edits have made it better? I found that User:SeaGriffin had added some sentences from the IPCC report without paraphrasing them which is then a copyright violation - which nobody seems to have noticed do far. So I quickly changed them by adding quotes; now it's a quote, no longer a copyright violation. Now it's just "bad prose", which can be fixed later by someone who has time. What would have been the alternative? I could have simply deleted the content that had been added by that user, would you have preferred that? I think that would have been a worse solution.
Regarding asking someone who is knowledgeable on copyright, let me ping User: Moneytrees again. We had already asked them here and they had written: "When it comes to the subject of excessive quotations/ "quote farms" there's no exact policy/agreement on what constitutes "too much". I generally base it off of the context; what is editorially "too much" or otherwise unneeded? What can be said without quoting directly from the source?". Would you say there are excessive quotations now at marine heatwave?
Overall, you seem very adamant that quotes from the IPCC reports are to be avoided at all costs... For a featured article like the climate change article, which you have worked on a lot, I can see the merits of this approach. But for a small article like marine heatwave (only 30 pageviews per day!) do we really need to argue and spend time on something so minor? Could it be the case that you risking this: Perfect is the enemy of good? EMsmile (talk) 19:03, 20 March 2023 (UTC)[reply]
Deleted one quote, as the sentence (in the IPCC report) seemed to be missing some verbs. This is certainly not a page to lose sleep over. I'm not saying that quotes to academic sources should be avoided at all costs. In a definition section they can be welcome. It's just thatquoting academic sources almost always makes text more difficult, and thereby less inclusive of people without uni education. —Femke 🐦 (talk) 02:41, 21 March 2023 (UTC)[reply]
I agree with you on that point about trying to make it all more inclusive so that everyone can understand our Wikipedia content. I guess my point was that I see this often - and in particular in this case - as an iterative approach: (1) A student identifies the relevant sentence that needs to go into a Wikipedia article. (2) They copy it straight in. (wrong, I know, but not my fault) (3) I then change it to a quote to avoid copyright vio. (4) Later, someone else (or me when I have a clearer head) has a bright idea of how to say this in simpler language and they make that improvement. EMsmile (talk) 00:05, 23 March 2023 (UTC)[reply]
Example of converting IPCC text to easier language
I am giving an example below to show my efforts in trying to make IPCC language easier to understand. I started off with this paragraph:
"It is virtually certain that sea surface temperatures (SSTs) will continue to increase in the 21st century, at a rate depending on emission scenarios: "The future global average SST increase projected by CMIP6 models for the period 1995–2014 to 2081–2100 is 0.86°C under SSP1-2.6, 1.51°C under SSP2-4.5, 2.19°C under SSP3-7.0, and 2.89°C under SSP5-8.5"."
The second sentence was of course really hard to understand My new version is this (a bit longer) - is it better? Too long?
"Sea surface temperatures will continue to increase with global warming, and therefore the frequency and intensity of marine heatwaves will also increase. The extent of ocean warming depends on emission scenarios, and thus humans' climate change mitigation efforts. Simply put, the more greenhouse gas emissions (or the less mitigation), the more the sea surface temperature will rise. Scientists have calculated this as follows: there would be a relatively small (but still significant) increase of 0.86°C in the average sea surface temperature for the low emissions scenario (called SSP1-2.6). But for the high emissions scenario (called SSP5-8.5) the temperature increase would be as high as 2.89°C.[1]: 393 This is calculated with a mathematical model called CMIP6. It is for the future period 2081–2100 compared to the past period 1995–2014."
Looking at it again, it does make me wonder if I have now added too much of my own interpretation when I point out "a relatively small (but still significant) increase of 0.86°C"? This is the danger once we start to try and explain what the IPCC reports are telling us... EMsmile (talk) 00:12, 23 March 2023 (UTC)[reply]
Hi EMsmile. Let me see if I can help. It was disheartening to see you've had trouble with copy right, as you've always been such a pleasant editor to collaborate with, and we dont have many with your sort of energy improving this topic class.
Your version should be easier for a non-uni educated reader to understand. But yes maybe a bit long, and some could see it as an OR violation. (Though IMO .86°C is both a significant increase, and relatively small compared to the less optimistic SSPs.)
You're right that IPCC text is maybe uniquely difficult to improve on without losing something - as they spend much time to find the best possible words. Still, there are ways to quickly make the language easier to understand without risking any false OR - by reducing the comprehensiveness and precision from the original writing.
So your above example could be written simply as "It is expected for sea surface temperatures to further increase through the 21st century. The rate of increase will depend on future GHG emissions."
Let's look at the example from the section above. marine heatwaves will very likely further increase in frequency, duration, spatial extent and intensity This could be simplified just by omitting 'spatial extent' , or by changing it to 'size'. Just a small decrease in sentence lenght can yield a worthwhile increase in Flesch Reading Ease Score. We'd also want to change the sentence structure a bit, otherwise it would still be close paraphrasing. E.g., to something like "It is expected that the frequency, duration and intensity of marine heatwaves will continue to increase".
You can often have your cake and eat it by including the actual quote in the ref (using the quote parameter.) Or sometimes one can include longer quotes in a 'note' as was done here.
As you know, there's at least two separate reasons to want to avoid using quotes from scientific sources: Understandability & Copyright, with the latter being by far the highest priority to comply with. As you're unfortunately under a CCI, I'd suggest erring on the side of caution and not including 3-4 line quotes and above even in the 'quote' parameter. But purely from the copyright point of view, there should be no harm in having a couple of direct one line quotes in any one article.
So in summary, my advise would be that while it's nice to totally re-write in your own words, in cases where you can't see a way to do that quickly, it's fine for you to resolve CC concerns by putting quotation marks round the occasional quote, as long as it's 1-2 lines max. Like you say, dont let the perfect be the enemy of the good! FeydHuxtable (talk) 10:33, 24 March 2023 (UTC)[reply]
Hi FeydHuxtable thanks for your words of encouragement and help here. I find that this kind of work is so much easier when one can bounce ideas off each other and improve it progressively and in a team effort kind approach. So thank you.
I've just now made some further improvements to the article, using your suggestion as guidance.
I've never used the quote parameter in the refs, perhaps I should start with that. But I always felt it makes the references list overly bloated. Also, I feel that a "notes" section makes the article often seem overly academic and daunting. So those are trade-offs, I guess. The quotes in the ref list might be useful for when the sources are behind a paywall. But if the source is freely available and the page number is provided then maybe it's of lesser importance to also include the quote in the ref list. EMsmile (talk) 13:09, 28 March 2023 (UTC)[reply]
You're most welcome. I didnt know you could add different pages number to different instances of the same named ref until now, that eliminates one of the reasons I've had for occasionally using the quote param. Another reason is in cases where the quote is radically simplified, it might be convenient for some readers to have the full quote if they want to know the detailed info. But I see what you mean about bloat, some of these IPPC refs are already long enough.. FeydHuxtable (talk) 15:09, 28 March 2023 (UTC)[reply]
Should it be added? The ESA is categorizing it as a Category IV/V marine heatwave tied it along the hottests SST that the waters around the UK has experienced in recorded history. ESA source hereZenixtronix (talk) 19:35, 7 August 2023 (UTC)[reply]
Sea surface temperature from 1979 to 2023 in the region between 60 degrees south and 60 degrees north (oldest years are blue, intermediate years are white, the most recent years are red).
I wonder if someone has an idea for a better image in the lead? The one we currently have is a bit outdated. I've just added to the article a powerful image that we also have at sea surface temperature (see on the right) but I don't think that one is suitable for the lead. EMsmile (talk) 08:53, 26 August 2023 (UTC)[reply]
Avoid an image of a specific heatwave and go for an defining image, what is a marine heatwave?
I am undecided about that option. Is it "visual" enough or does it require too much reading? Perhaps better if we could update that world map which User:Lamiot had created, as it also shows where those heatwaves take place? EMsmile (talk) 08:48, 27 August 2023 (UTC)[reply]
File:Marine Heatwave Categories-en.svg matches the definition in the lede: "a period of abnormally high ocean temperatures" with a definition of the required period on the x-axes and the definition of abnormally high temperatures on the y-axis.
That world map by Lamiot shows several examples of heatwaves for several years, not just one. The image with the categories is not very visual, as people first have to read the axes and titles to understand what they are seeing. I think that is sub-optimal for a lead. See also MOS:LEADIMAGE: "It is common for an article's lead or infobox to carry a representative image—such as of a person or place, a book or album cover—to give readers visual confirmation that they've arrived at the right page." EMsmile (talk) 09:27, 27 August 2023 (UTC)[reply]
Agree to go for a easy visual that speaks for itself, does not require any text reading.
good: the world map shows that it is about water temperature.
confusing: large parts of water are white, just like land surface.
confusing: it requires text reading to know that it depicts multiple heatwaves
I like that the image is current (up to date) but I don't like how the land is shown in black (confusing at first sight) and even worse, it might just be a map of sea surface temperature rise whereas a marine heatwave is a) something that has been there even before we had climate change but now it's becoming more frequent and b) has a time dimension, i.e. higher temps for a certain period of time. That map that you found talks about "anomalies", are we sure they mean marine heatwaves with that?
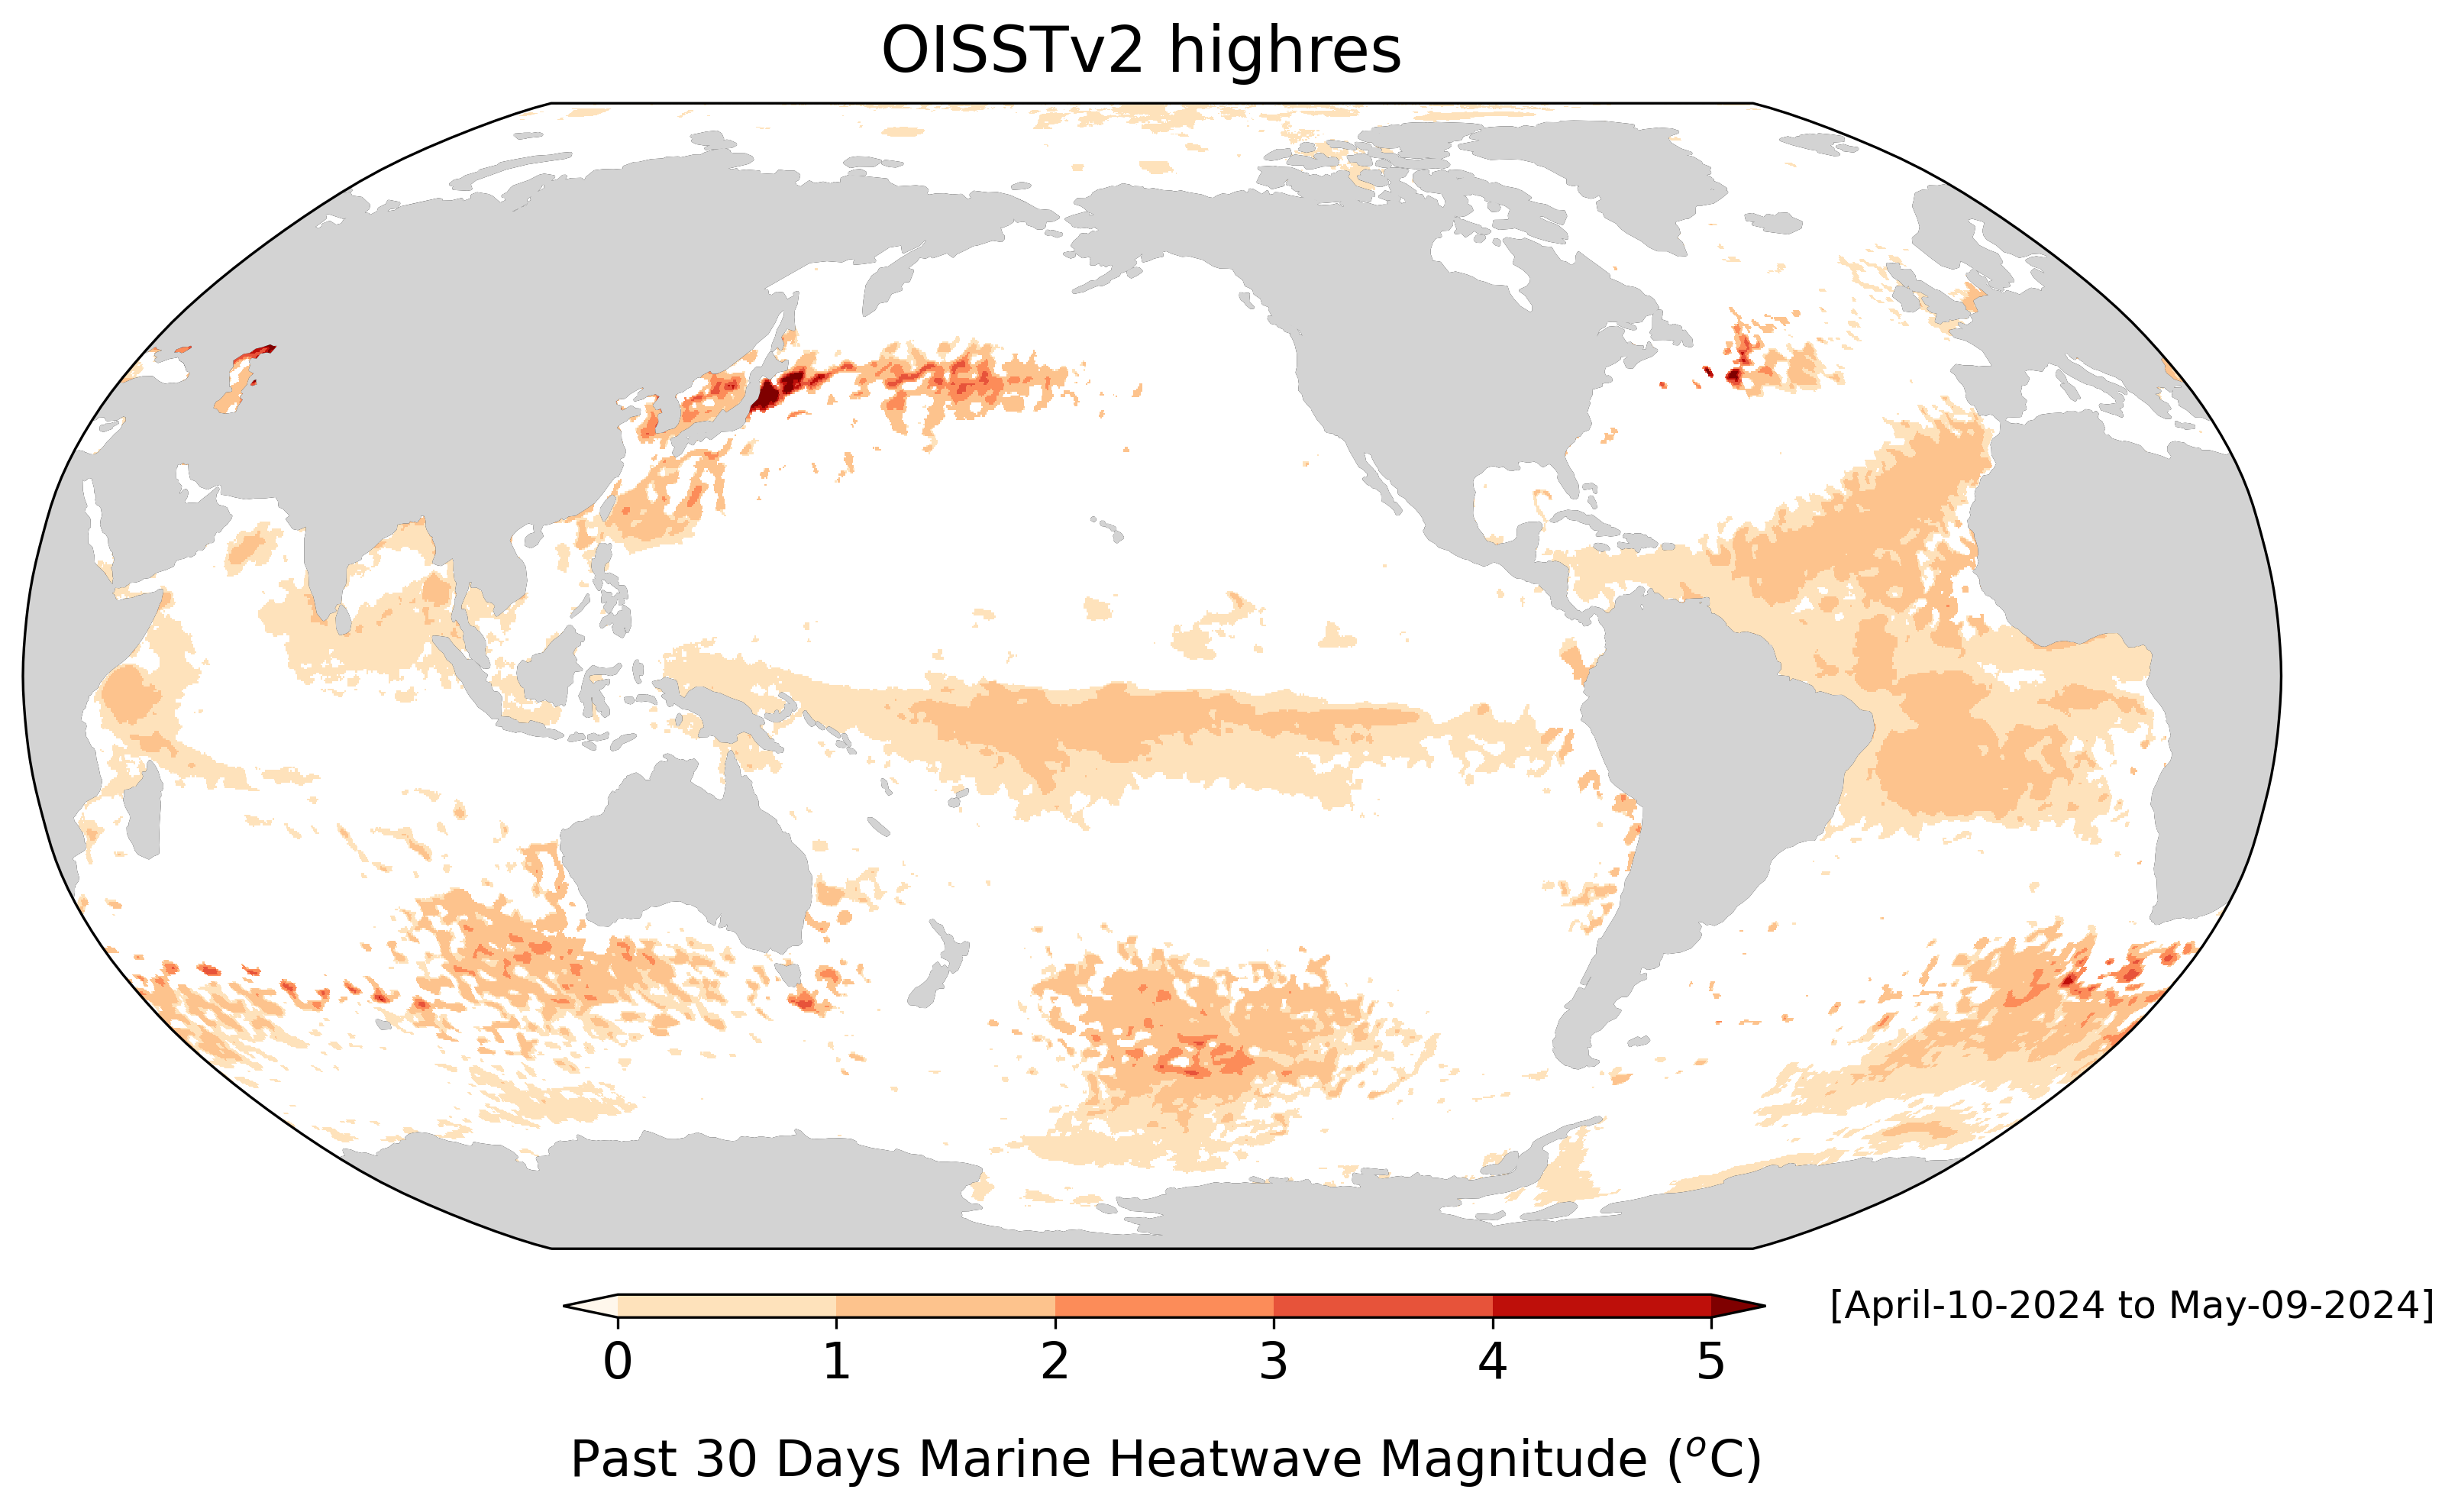
Can you find perhaps a bar chart or a stripe chart that shows the number of marine heatwaves globally per year or per decade and then shows how this number has been going up in recent decades?
My main activity has been bar charts and line charts, and my brief Google search of public domain images doesn't yield any marine-heat-wave-versus-time charts. Regardless, in this article I lean slightly toward maps rather than charts. One pleasant map generator is found at https://psl.noaa.gov/marine-heatwaves/ , though that map covers the most recent 30 days—not ideal for an encyclopedia focused on longer terms. —RCraig09 (talk)22:31, 27 August 2023 (UTC)[reply]
Yes, there have been marine heatwaves before the current climate change. Yes, marine heatwaves are now more frequent. All true, but climate change and marine heatwave are two separate concepts, with two separate articles.
An image that depicts an increasing number of marine heatwaves would suit the article about climate change, yet not visualize your point b), what is a marine heatwave? My suggestion is to find an image that suits your point b and the definition in the lede: "a period of abnormally high ocean temperatures". Uwappa (talk) 11:40, 29 August 2023 (UTC)[reply]
@Uwappa: I can't be sure which license applies, because your link points to the graphic itself and not to the page that uses the graphic. However, you can see if {{PD-USGov-NOAA}} (on commons.wikimedia.org) applies. —RCraig09 (talk)14:48, 18 September 2023 (UTC)[reply]
Using a short-term (30-day) graphic that becomes obsolete in one day, is a bit unencyclopedic, not to mention challenging to maintain. I think one should keep an eye out for a more long-term graphic that teaches something about marine heatwaves in general. —RCraig09 (talk)22:20, 18 September 2023 (UTC)[reply]
A high pressure system in the upper atmosphere traps heat near the ground, forming a heatwave (for North America as an example) I have improved the caption now. I think it's fine like this and there is no need to update it any more often than any other graphs in Wikipedia articles. But yes, if there was a graph or map showing marine heatwaves in the last 5 years that would also be good. Or if we rather want a schematic in the lead, should we look for something similar to the schematic used for heat wave? See on the right.
Yes EMsmile, I would prefer a schematic image, independent of a specific location and date range. It would probably look like half an onion:
flat side up at the sea surface, with the hot core in the center.
Layers of lower temperatures will be around that core, towards the edges and deeper into the ocean.
Sorry for the late reply, Uwappa. Yes, that looks great! And the paper is CC BY so I assume also the images are compatibly licenced. I think Figure 1 and 2 would be a great addition. Perhaps Figure 1 for the lead as it's easier to grasp quickly? I see we already cite that paper about 20 times but hadn't yet included any images from it. Do you have time to add the figures and perhaps also some sentences about the different drivers (if not already in there)? Would be awesome. EMsmile (talk) 09:03, 25 October 2023 (UTC)[reply]
Some second thoughts:
[figure 1] list temperature (b. intensity) and minimum 5 days (c. duration). Yet it does not specify 'beyond t90' for temperature. It lacks a clear duration upper bound. It also lists regions and frequency which are not relevant for the definition.
[figure 2] lacks a core element, rise of temperature beyond T90.
An image that defines marine heatwaves should show:
you're overthinking it. ;-) I would say, throw in the two figures and give them appropriate captions. They will be useful for our readers. Even a non-perfect image is better than no image. EMsmile (talk) 12:08, 25 October 2023 (UTC)[reply]
Sorry, but that is a no from me. We already have non perfect images that score 2 out of 3.
I think the images are useful and are from a very reputable source (from which we have already used a lot of text). So I see no reason not to add them. I might do it later. EMsmile (talk) 14:16, 25 October 2023 (UTC)[reply]
combine temperature and time to one category colour, yellow to red for categories I to IV as in
show category colours in a map.
The result would be similar to , but with colours for categories, not temperatures.
Disadvantage: it would be an image for experts who know about categories. The yellow-red colours could easily be mistaken for temperatures. Uwappa (talk) 02:53, 26 October 2023 (UTC)[reply]
I have no experience with creating own images, so can't really comment on that. Meanwhile, I have added the two figures from the Hobday publication. For now, we have two images in the lead which is not ideal but I think in this case it might be justifiable. EMsmile (talk) 07:34, 26 October 2023 (UTC)[reply]


 temperature
  time
time 


 , but with colours for categories, not temperatures.
 from lead down to Definiton
 from Definition as it now overlaps with