
Tropical cyclones in 1992
| Tropical cyclones in 1992 | |
|---|---|
| Year boundaries | |
| First system | Axel |
| Formed | January 3, 1992 |
| Last system | Kina |
| Dissipated | January 5, 1993 |
| Strongest system | |
| Name | Gay |
| Lowest pressure | 900 mbar (hPa); 26.58 inHg |
| Longest lasting system | |
| Name | Tina |
| Duration | 25 days |
| Year statistics | |
| Total systems | 120 |
| Named systems | 93 |
| Total fatalities | 995 total |
| Total damage | $33.926 billion (1992 USD) |

The year 1992 featured the highest amount of accumulated cyclone energy (ACE) on record, with an ACE rating of 1,163.1 units.[1] It would be regarded as one of the most intense tropical cyclone years on record. Throughout the year, 111 tropical cyclones formed, of which 101 were given names by various weather agencies. Five Category 5 tropical cyclones would form in 1992.
Tropical cyclones are primarily monitored by a group of ten warning centers, which have been designated as a Regional Specialized Meteorological Center (RSMC) or a Tropical Cyclone Warning Center (TCWC) by the World Meteorological Organization. These are the United States National Hurricane Center (NHC) and Central Pacific Hurricane Center, the Japan Meteorological Agency (JMA), the India Meteorological Department (IMD), Météo-France, Indonesia's Badan Meteorologi, Klimatologi, dan Geofisika, the Australian Bureau of Meteorology (BOM), Papua New Guinea's National Weather Service, the Fiji Meteorological Service (FMS) as well as New Zealand's MetService. Other notable warning centres include the Philippine Atmospheric, Geophysical and Astronomical Services Administration (PAGASA), the United States Joint Typhoon Warning Center (JTWC), and the Brazilian Navy Hydrographic Center.
Summary
[edit]
North Atlantic Ocean
[edit]
The Atlantic hurricane season officially began on June 1,[2] but activity in 1992 began more than a month earlier with the formation of Subtropical Storm One on April 21. It was a below average season in which 10 tropical or subtropical depressions formed. Seven of the depressions attained tropical storm status, and four of these attained hurricane status. In addition, one tropical cyclone eventually attained major hurricane status,[3] which is below the 1981–2010 average of 2.7 per season.[4] The low amount of activity is partially attributed to weaker than normal tropical waves, the source for most North Atlantic tropical cyclones.[5] Only two hurricanes and one tropical storm made landfall during the season. However, damage from Hurricane Andrew was astronomical, causing most of the season's 73 deaths and $27.3 billion (1992 USD) damage toll.[3][6][7][8][9][10]
Tropical cyclogenesis in the 1992 Atlantic hurricane season began with the development of Subtropical Storm One on April 21. However, over the next three months, minimal activity occurred, with only two depressions developing, one in June and the other in July.[3] Although wind shear was relatively weak in August,[5] only one tropical cyclone occurred in that month. However, that one tropical cyclone, Hurricane Andrew, was the strongest and costliest of the season.[3] Though September is the climatological peak of hurricane season,[11] an increase in wind shear prevented tropical cyclogenesis in the first half of the month. After September 16, however, five tropical cyclones developed in a span of nine days, from September 17 to 26. Thereafter, activity abruptly halted, and only one tropical cyclone developed in October, Hurricane Frances. By October 27, Frances became extratropical, ending season activity.[12] The season's activity was reflected with an accumulated cyclone energy (ACE) rating of 76, which is classified as "near normal". ACE is, broadly speaking, a measure of the power of the hurricane multiplied by the length of time it existed, so storms that last a long time, as well as particularly strong hurricanes, have high ACEs. It is only calculated for full advisories on tropical systems at or exceeding 39 mph (63 km/h), which is the threshold for tropical storm strength.[13]
Eastern & Central Pacific Oceans
[edit]
Warmer than usual sea surface temperatures due to an El Niño fostered the high level of tropical activity during the year.[14] The season officially started on May 15, 1992, in the eastern Pacific, and on June 1, 1992, in the central Pacific. It ended in both basins on November 30, 1992. During the season, twenty-seven tropical cyclones formed in the Eastern Pacific (east of longitude 140°W), and twenty-four developed further and became tropical storms. Both of these figures constitute records in the basin, as the 1992 season surpassed the season with the most tropical cyclones (1982, 26) and the season with the most named storms (1985, 22). Of these, fourteen reached hurricane strength and eight became major hurricanes—storms that reach Category 3 or higher on the Saffir-Simpson Hurricane Scale.[15]
This season had five storms reach tropical storm intensity or higher in the month of October, the first time on record that this had happened in this basin. In addition, Hurricanes or Tropical Storms Winifred through Zeke are the earliest twenty-first through twenty-fourth named storms in a season in the eastern north Pacific.[16] The Central Pacific (between 140°W and the International Date Line) saw similarly high levels of activity. Eleven tropical cyclones were tracked by the Central Pacific Hurricane Center throughout the hurricane season. Of those, eight developed in the Eastern Pacific and crossed into the Central Pacific, and three formed within the basin. Two of the storms strengthened to major hurricane status within the Central Pacific's boundaries.[14]
The first storm of the season, Ekeka, formed on January 26, and was the first recorded January central Pacific hurricane. Later in the season, Iniki, crossed into the basin as a tropical depression, strengthened to a Category 4 hurricane, and made landfall in Hawaii, becoming the most destructive hurricane in the state's history.[14] The Accumulated Cyclone Energy (ACE) index for the 1992 Pacific hurricane season (Eastern Pacific and Central Pacific combined) as calculated by Colorado State University using data from the National Hurricane Center was 294.3 units, the second highest value on record for a Northeastern Pacific season.[17]
Western Pacific Ocean
[edit]
There were a total of 40 tropical cyclones in the Western Pacific in 1992. 39 of these formed within the basin, and 1 storm, Tropical Storm Ekeka, formed in the Central Pacific basin, crossing the Date Line to enter the Western Pacific. Out of the 39, 32 became named tropical storms, 21 reached typhoon intensity, and 5 reached super typhoon strength. Storms are listed in numerical ascending order by their JTWC tropical depression numbers except for Ekeka, and not in alphabetical order of names. Thus, Tropical Storm Zack (22W) is listed before Super Typhoon Yvette (23W). The season was hyperactive, featuring the highest Accumulated Cyclone Energy (ACE) for a Pacific typhoon season on record at the time, until it was surpassed by the 1997 Pacific typhoon season. The ACE index for the 1992 Pacific typhoon season as calculated by Colorado State University using data from the Joint Typhoon Warning Center was 470.1 units.[18]
North Indian Ocean
[edit]
It was unofficially the most active year on record for the basin, with 10 tropical storms developing, according to the Joint Typhoon Warning Center (JTWC).[19] Overall, there was a total of 12 depressions, of which 7 became cyclonic storms, and 1 further strengthened to a very severe cyclonic storm.[20] These totals were slightly above the long-term average of 5.4 cyclonic storms for the basin.[21] In contrast to this, the JTWC reported record-breaking activity with 13 tropical cyclones, 11 of which became tropical storms. This included record activity in the months of October and November, each having three storms, while July saw its first system on record.[19] The first storm of the year was Cyclonic Storm BOB 01 which formed on May 16 while the last was Deep Depression ARB 04 which dissipated over Somalia on December 24. The most intense was Very Severe Cyclonic Storm Forrest, which attained peak three-minute sustained winds of 185 km/h (115 mph).[20] Severe Cyclonic Storm BOB 07 proved to be the deadliest and most destructive of the year, claiming 263–423 lives across southern India and leaving $69 million in damage. Collectively, the season's storms killed at least 400 people and left another 549 missing.
South-West Indian Ocean
[edit]January - June
[edit]July - December
[edit]Australian Region
[edit]January - June
[edit]July - December
[edit]South Pacific Ocean
[edit]January - June
[edit]July - December
[edit]South Atlantic Ocean
[edit]Systems
[edit]January
[edit]
In January, the Intertropical Convergence Zone (ITCZ), which allows for the formation of tropical waves, is located in the Southern Hemisphere, remaining there until May.[22] This limits Northern Hemisphere cyclone formation to comparatively rare non-tropical sources.[23] In addition, the month's climate is also an important factor. In the Southern Hemisphere basins, January, at the height of the austral summer, is the most active month by cumulative number of storms since records began. Of the four Northern Hemisphere basins, none is very active in January, as the month is during the winter, but the most active basin is the Western Pacific, which occasionally sees weak tropical storms form during the month.[24] January was mildly active, with six tropical cyclones forming, while four were named.[25]
Tropical Storm Bryna from the South-West Indian Ocean persisted into 1992 and made landfall in Madagascar, dropping heavy rainfall and causing some damage and two deaths in Mahajanga. The year began with the formation of Severe Tropical Storm Axel in the Western Pacific Ocean on January 4. During its journey at sea, Axel caused havoc on some islands such as the Marshall Islands, Caroline Islands, and Mariana Islands in the Federated States of Micronesia; at least $1 million in damages occurred.
| Storm name | Dates active | Max wind km/h (mph) |
Pressure (hPa) |
Areas affected | Damage (USD) |
Deaths | Refs |
|---|---|---|---|---|---|---|---|
| Axel | January 4 – 15 | 100 (65) | 980 | Marshall Islands, Caroline Islands, Mariana Islands | $1 million | None | [26][27] |
| Betsy | January 4 – 14 | 165 (105) | 940 | Vanuatu | Unknown | 4 | [28] |
| Mark | January 7 – 10 | 100 (65) | 980 | Northern Territory,Queensland | $3.6 million | None | [29] |
| 16S | January 13 | Unknown | 1004 | None | None | None | |
| 13P | January 16–18 | Unknown | Unknown | None | None | None | |
| Ekeka | January 28 – February 8 | 185 (115) | 982 | None | None | None | [30] |
February
[edit]
In terms of activity, February is normally similar to January, with activity effectively restricted to the Southern Hemisphere excepting the rare Western Pacific storm. In fact, in the Southern Hemisphere, due to the monsoon being at its height,[24] February tends to see more formation of strong tropical cyclones than January despite seeing marginally fewer overall storms. In the Northern Hemisphere, February is the least active month, with no Eastern or Central Pacific tropical cyclones[16] and only one Atlantic tropical cyclone having ever formed in the month.[12] Even in the Western Pacific, February activity is low: in 1992, the month had never seen a typhoon-strength storm, the first being Typhoon Higos in 2015. February 1992 was the record-breaking most active month ever recorded in the history of worldwide tropical cyclogenesis with twelve systems forming and ten storms getting named.
| Storm name | Dates active | Max wind km/h (mph) |
Pressure (hPa) |
Areas affected | Damage (USD) |
Deaths | Refs |
|---|---|---|---|---|---|---|---|
| Cliff | February 5–9 | 95 (60) | 980 | French Polynesia | Unknown | Unknown | |
| Celesta | February 8–14 | 85 (50) | 985 | None | None | None | [31] |
| Daman | February 11–19 | 155 (100) | 965 | New South Wales | Unknown | Unknown | [32] |
| Davilia | February 16–25 | 75 (45) | 988 | None | None | None | [33] |
| 18P | February 19–20 | 65 (40) | 997 | Queensland | Unknown | Unknown | [34][35] |
| Elizabetha | February 22–26 | 65 (40) | 992 | Madagascar | Unknown | None | [36] |
| Farida | February 24 –March 4 | 150 (90) | 941 | None | None | None | [37] |
| Harriet-Heather | February 24 –March 8 | 215 (130) | 930 | Western Australia | $6 million | Unknown | [38][39] |
| Esau | February 24 – Mar 9 | 185 (115) | 925 | Solomon Islands, Vanuatu, New Caledonia, New Zealand | Minimal | 1 | [40][41] |
| Gerda | February 24 – March 4 | 65 (40) | 992 | Mauritius | None | None | [42] |
| H1 | February 26 – March 1 | 55 (35) | 995 | None | None | None | [43] |
| Ian | February 27 – March 4 | 215 (130) | 930 | Western Australia | Minimal | None | [44] |
March
[edit]
During March, activity tends to be lower than in preceding months. In the Southern Hemisphere, the peak of the season has normally already passed, and the monsoon has begun to weaken, decreasing cyclonic activity, however, the month often sees more intense tropical cyclones than January or February. Meanwhile, in the Northern Hemisphere basins, sea surface temperatures are still far too low to normally support tropical cyclogenesis. The exception is the Western Pacific, which usually sees its first storm, often a weak depression, at some point between January and April.
In 1992, a total of four systems formed during March, all of them intensified into tropical storms. The most intense storm of the month was Cyclone Fran, which formed in the South Pacific Ocean on 4 March. It intensified to attain a pressure of 920 hPa (27.17 inHg), making Fran the most intense storm thus far in the year. In late March, meteorological conditions similar to what allowed Ekeka to develop persisted in the central Pacific. An area of convection organized into Tropical Depression Two-C, just north of 5˚N, atypically close to the equator, and far to the southwest of Hawaii. Moving west-northwestward, it slowly intensified, intensifying into a tropical storm on March 29. Upon doing so, the CPHC gave it the name Hali. Later that day, the storm attained peak winds of 50 mph (80 km/h), before increased southwesterly wind shear imparted weakening. Hali was downgraded to a tropical depression on March 30, and it dissipated shortly thereafter. It never affected land.[14]
| Storm name | Dates active | Max wind km/h (mph) |
Pressure (hPa) |
Areas affected | Damage (USD) |
Deaths | Refs |
|---|---|---|---|---|---|---|---|
| Fran | March 4–17 | 205 (125) | 920 | Wallis and Futuna, Fiji, Vanuatu, New Caledonia, Australia | $9.4 million | 5 | [45][46][47] |
| Gene | March 15–19 | 95 (60) | 985 | Cook Islands | Unknown | Unknown | |
| Hettie | March 23–29 | 75 (45) | 987 | French Polynesia | Minimal | None | [48] |
| Hali | March 28–30 | 85 (50) | 1004 | None | None | None |
April
[edit]
The factors that begin to inhibit Southern Hemisphere cyclone formation in March are even more pronounced in April, with the average number of storms formed being hardly half that of March.[24][49] However, even this limited activity exceeds the activity in the Northern Hemisphere, which is rare, with the exception of the Western Pacific basin. All Pacific typhoon seasons between 1998 and 2016 saw activity between January and April, although many of these seasons saw only weak tropical depressions.[50] By contrast, only two Atlantic hurricane seasons during those years saw tropical cyclone formation during that period.[12] With the combination of the decreasing temperatures in the Southern Hemisphere and the still-low temperatures in the Northern Hemisphere, April and May tend to be the least active months worldwide for tropical cyclone formation.[49]
April 1992 was an example of this phenomenon, with only five tropical cyclones forming, and only three becoming tropical storms, making the month the second-least active of 1992.[49] Of those two storms, the stronger was Tropical Cyclone Jane-Irna, which formed in the Australian region on 8 April and crossed over to the South-West Indian Ocean before dissipating on 14 April. Tropical cyclogenesis in the annual Atlantic hurricane season began with the development of Subtropical Storm One on April 21.
| Storm name | Dates active | Max wind km/h (mph) |
Pressure (hPa) |
Areas affected | Damage (USD) |
Deaths | Refs |
|---|---|---|---|---|---|---|---|
| Unnamed | April 7–8 | Unknown | Unknown | None | None | None | [51] |
| Neville | April 7–13 | 215 (130) | 945 | Northern Territory, Western Australia | Minimal | None | [52] |
| Jane-Irna | April 8–19 | 215 (130) | 930 | None | None | None | [53][54] |
| One | April 21–24 | 85 (50) | 1002 | None | None | None | [55] |
| Innis | April 23 – May 2 | 95 (60) | 985 | Tokelau, Solomon Islands, Vanuatu | None | None | [56][57] |
May
[edit]
Around the middle of May, the Intertropical Convergence Zone (ITCZ), which allows for the formation of tropical waves and has previously remained in the Southern Hemisphere for the first five months of the year, moves to the Northern Hemisphere, allowing the northern cyclone seasons to start in earnest.[22] Without the presence of the ITCZ, Southern Hemisphere cyclones must form from non-wave sources, which are rarer.[23] For that reason, cyclone formation is relatively sparse, with May tending to be the month of the final storm in each of the three basins. Meanwhile, more intense storms are nearly unheard of, with the South-West Indian Ocean having seen only one intense tropical cyclone and no very intense tropical cyclones in the month, and the other two basins having similar levels of activity in May. In the Northern Hemisphere, May is the first month most basins see activity, due to the new presence of the ITCZ. The Pacific hurricane season begins on May 15, and although the Atlantic hurricane season officially begins on June 1, off-season storms are very common, with over half of the 21st century seasons seeing a storm form in May.[58] Although the North Indian Ocean has no official start or end date, due to the monsoon, mid-May is the beginning of a month-long period of high activity in the basin. Even in the Western Pacific, activity tends to increase throughout May.
May 1992 was the record-breaking least active month ever recorded in the history of worldwide tropical cyclogenesis with only one tropical cyclone within the month – BOB 01 – the first cyclonic storm of the 1992 North Indian Ocean cyclone season. Although Tropical Cyclone Innis was active in the month, it was counted for the month of April, as that was the month it formed in.
| Storm name | Dates active | Max wind km/h (mph) |
Pressure (hPa) |
Areas affected | Damage (USD) |
Deaths | Refs |
|---|---|---|---|---|---|---|---|
| BOB 01 | May 16–20 | 65 (40) | 992 | Myanmar (Rakhine State) | Unknown | 27–46 | [59][60] |
June
[edit]
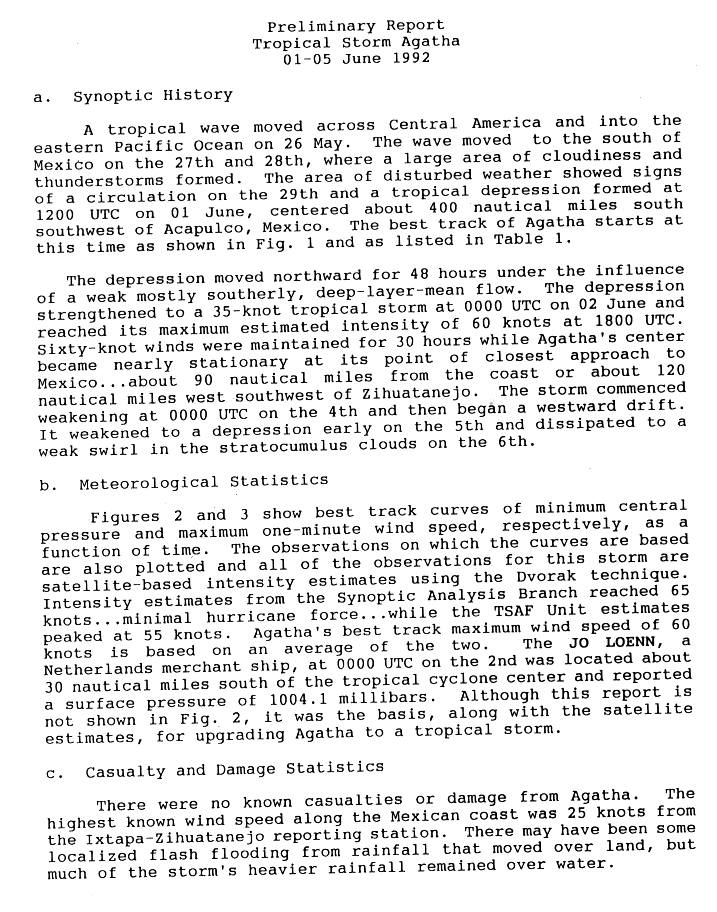
June was active, with ten tropical cyclones forming, while six were named. Tropical Storm Agatha in the eastern Pacific Ocean killed 10 people in southwestern Mexico. Typhoon Bobbie, alongside with Typhoon Chuck in the western Pacific Ocean caused heavy rains and mudslides on the northern Philippine islands, causing $27.2 million in damage
| Storm name | Dates active | Max wind km/h (mph) |
Pressure (hPa) |
Areas affected | Damage (USD) |
Deaths | Refs |
|---|---|---|---|---|---|---|---|
| Agatha | June 1–5 | 110 (70) | 990 | Southwestern Mexico | Minimal | 10 | [61] |
| ARB 01 | June 5–12 | 85 (50) | 994 | None | None | None | |
| Two-E | June 16–19 | 55 (35) | 1009 | None | None | None | |
| BOB 02 | June 17–18 | 55 (35) | 980 | India | Unknown | 48-418 | |
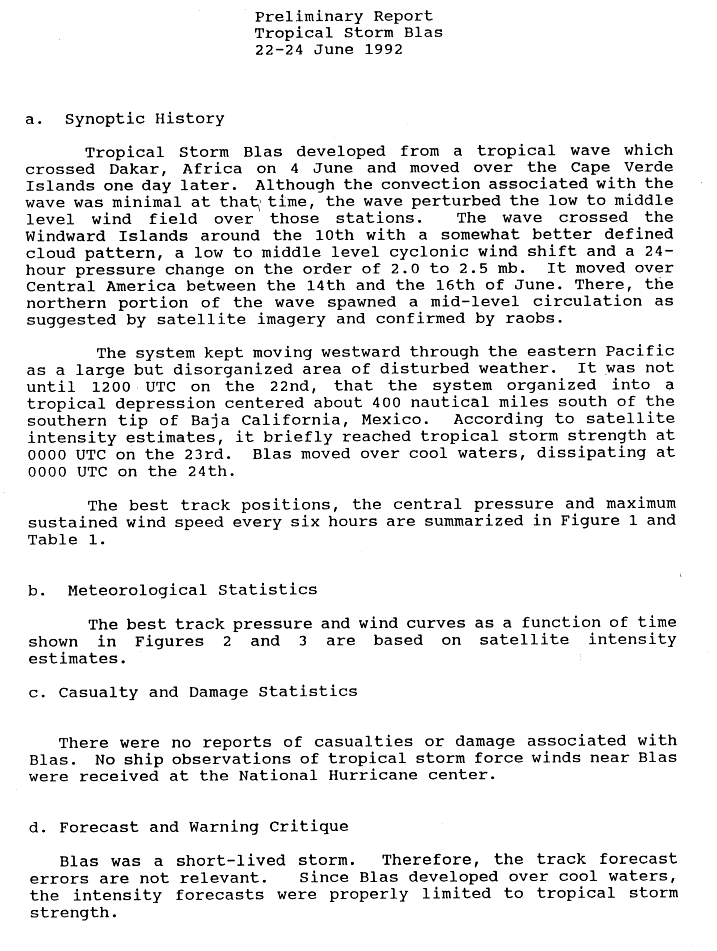
| Blas | June 22–23 | 65 (40) | 1004 | None | None | None | [62] |
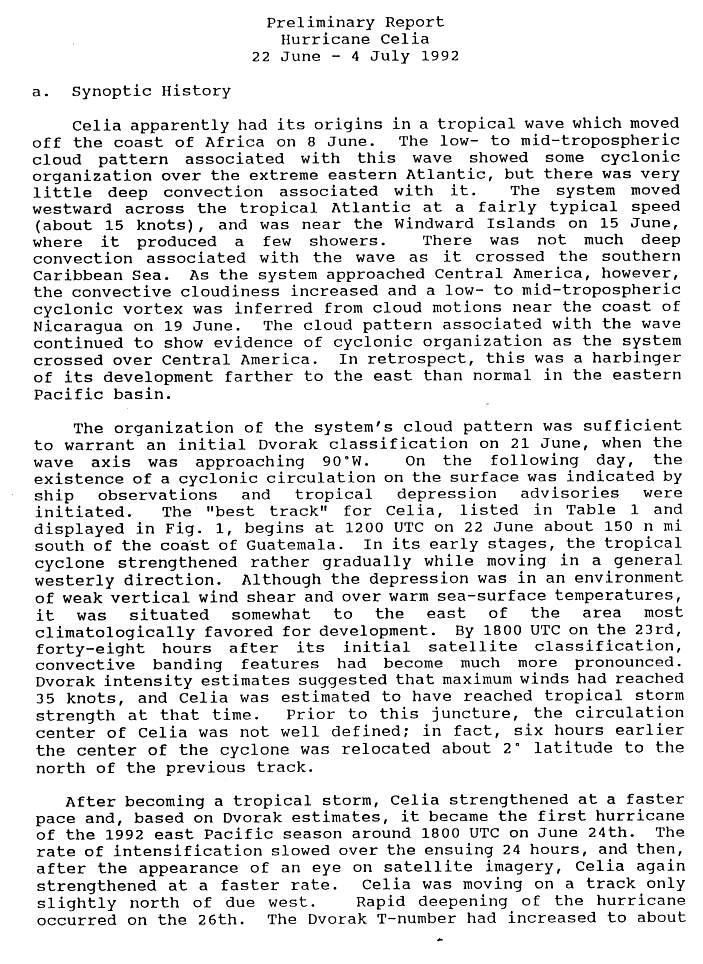
| Celia | June 22 – July 4 | 230 (145) | 935 | None | None | None | [63] |
| Bobbie (Asiang) | June 23–30 | 165 (105) | 940 | Philippines, Japan | $27.2 million | None | [64] |
| Chuck (Biring) | June 24 – July 1 | 130 (80) | 965 | Philippines, South China, Vietnam | Unknown | 7 | |
| One | June 25–26 | 55 (35) | 1007 | Cuba, Florida | $2.6 million | 5 | |
| Deanna | June 28 – July 3 | 75 (45) | 1002 | Caroline Islands | None | None |
July
[edit]
July was very active, with sixteen tropical cyclones forming, while twelve were named. Hurricane Darby claimed three lives in its path.
| Storm name | Dates active | Max wind km/h (mph) |
Pressure (hPa) |
Areas affected | Damage (USD) |
Deaths | Refs |
|---|---|---|---|---|---|---|---|
| Darby | July 2–10 | 195 (120) | 968 | California | Minimal | 3 | |
| Eli (Konsing) | July 8–14 | 130 (80) | 965 | Caroline Islands, Philippines, South China, Vietnam | $235 million | 1 | |
| Estelle | July 5–12 | 220 (140) | 943 | None | None | None | |
| Frank | July 13–23 | 230 (145) | 935 | None | None | None | |
| Georgette | July 14–26 | 175 (110) | 964 | None | None | None | |
| Faye | July 15–18 | 65 (40) | 1000 | Philippines, South China | None | 2 | |
| Gary (Ditang) | July 17–24 | 100 (65) | 980 | Marshall Islands, Caroline Islands, Mariana Islands | $940 million | 48 | |
| Two | July 24–26 | 55 (35) | 1015 | None | None | None | |
| BOB 03 | July 24–28 | 55 (35) | 984 | India | |||
| Howard | July 26–30 | 100 (65) | 992 | None | None | None | |
| Helen | July 26–28 | 75 (45) | 996 | None | None | None | |
| Isis | July 28 – August 2 | 100 (65) | 992 | None | None | None | |
| TD | July 29 | Unknown | 1010 | None | None | None | |
| Javier | July 30 – August 12 | 130 (80) | 985 | None | None | None | |
| TD | July 30–31 | Unknown | 1012 | None | None | None | |
| Irving (Edeng) | July 31 – August 5 | 100 (65) | 980 | Japan, South Korea | $1 million | 3 |
August
[edit]
| Storm name | Dates active | Max wind km/h (mph) |
Pressure (hPa) |
Areas affected | Damage (USD) |
Deaths | Refs |
|---|---|---|---|---|---|---|---|
| Janis (Gloring) | August 3–9 | 175 (110) | 935 | Caroline Islands, Mariana Islands, Japan | $45.6 million | 2 | |
| Kent | August 6–19 | 175 (110) | 930 | Marshall Islands, Japan | Unknown | 5 | |
| Twelve-E | August 10–12 | 55 (35) | 1008 | None | None | None | |
| Lois (Huaning) | August 14–21 | 65 (40) | 996 | None | None | None | |
| Mark | August 15–19 | 85 (50) | 990 | China, Taiwan | $10.4 million | 1 | |
| Andrew | August 16–28 | 280 (175) | 922 | Bahamas, Gulf Coast of the United States, Midwestern United States, Mid-Atlantic states | $27.3 billion | 65 | |
| Nina | August 17–21 | 65 (40) | 996 | None | None | None | |
| Kay | August 18–22 | 85 (50) | 1000 | None | None | None | |
| Lester | August 20–24 | 130 (80) | 985 | Northwestern Mexico, Southwestern United States, Central United States, Midwestern United States, Mid-Atlantic states | $45 million | 3 | |
| TD | August 23–24 | Unknown | 1008 | Japan | None | None | |
| Omar (Lusing) | August 24 – September 9 | 185 (115) | 920 | Marshall Islands, Caroline Islands, Mariana Islands, Philippines, Taiwan, China, Ryukyu Islands | $561 million | 15 | |
| TD | August 25–26 | Unknown | 1000 | None | None | None | |
| Madeline | August 27–30 | 85 (50) | 999 | None | None | None | |
| Newton | August 27–30 | 85 (50) | 999 | None | None | None | |
| Polly (Isang) | August 27 – September 1 | 100 (65) | 975 | Taiwan, Ryukyu Islands, China | $450 million | 202 |
September
[edit]
| Storm name | Dates active | Max wind km/h (mph) |
Pressure (hPa) |
Areas affected | Damage (USD) |
Deaths | Refs |
|---|---|---|---|---|---|---|---|
| Ryan | September 1–11 | 155 (100) | 945 | Mariana Islands | None | None | |
| Orlene | September 2–14 | 230 (145) | 934 | None | None | None | |
| Sibyl | September 4–15 | 155 (100) | 940 | None | None | None | |
| Iniki | September 5–13 | 230 (145) | 938 | Hawaii | $3.1 billion | 6 | |
| Paine | September 11–16 | 120 (75) | 987 | None | None | None | |
| Roslyn | September 13–30 | 155 (100) | 975 | None | None | None | |
| Bonnie | September 17–30 | 175 (110) | 965 | Azores | None | 1 | |
| Seymour | September 17–27 | 140 (85) | 980 | None | None | None | |
| Tina | September 17 – October 11 | 240 (150) | 932 | Western Mexico | None | None | |
| Ted (Maring) | September 18–24 | 95 (60) | 985 | Philippines, Taiwan, East China, Korea | $360 million | 61 | |
| TD | September 19–20 | Unknown | 1004 | South China, Vietnam | None | None | |
| Charley | September 21–27 | 175 (110) | 965 | Azores | Minimal | None | |
| Danielle | September 22–26 | 95 (60) | 1001 | North Carolina, Maryland, New England | Minimal | 2 | |
| 05 | September 22–25 | 55 (35) | 1000 | Bangladesh, India | None | None | |
| Val | September 24–27 | 85 (50) | 990 | None | None | None | |
| Seven | September 25 – October 1 | 55 (35) | 1008 | None | None | None | |
| Earl | September 26 – October 3 | 100 (65) | 990 | Florida, Georgia, North Carolina | None | None | |
| Ward | September 27 – October 7 | 155 (100) | 945 | None | None | None | |
| Avoina | September 29 – October 4 | 75 (45) | 988 | None | None | None | |
| ARB 02 | September 30 – October 4 | 85 (50) | 996 | Oman, Saudi Arabia | None | None |
October
[edit]
| Storm name | Dates active | Max wind km/h (mph) |
Pressure (hPa) |
Areas affected | Damage (USD) |
Deaths | Refs |
|---|---|---|---|---|---|---|---|
| Virgil | October 1–5 | 215 (130) | 948 | Southwestern Mexico | Minimal | None | |
| Winifred | October 6–10 | 185 (115) | 960 | Western Mexico | $5 million | 3 | |
| BOB 04 | October 6–9 | 55 (35) | 998 | India | None | 60 | |
| TD | October 7 | Unknown | 1007 | Vietnam | None | None | |
| Yvette (Ningning) | October 7–17 | 185 (115) | 915 | Philippines | None | None | |
| Zack | October 8–16 | 75 (45) | 992 | Marshall Islands | None | None | |
| Xavier | October 13–15 | 75 (45) | 1003 | None | None | None | |
| Yolanda | October 15–22 | 100 (65) | 993 | None | None | None | |
| Angela (Osang) | October 15–30 | 120 (75) | 970 | Philippines, Vietnam, Laos, Cambodia, Malaysia, Thailand | Unknown | 49 | |
| Brian | October 17–25 | 150 (90) | 950 | Caroline Islands, Marshall Islands | None | None | |
| Colleen (Paring) | October 17–25 | 100 (65) | 985 | Philippines, Vietnam, Cambodia, Laos, Thailand, Myanmar | Unknown | Unknown | |
| Babie | October 18–21 | 75 (45) | 991 | None | None | None | |
| BOB 05 | October 22–25 | 65 (40) | 996 | Myanmar, Bangladesh | None | None | |
| Frances | October 13–27 | 140 (85) | 976 | Newfoundland, Iberian Peninsula | None | None | |
| Zeke | October 25–30 | 85 (50) | 999 | None | None | None | |
| Dan | October 25 – November 3 | 165 (105) | 935 | Marshall Islands | None | None | |
| Elsie (Reming) | October 29 – November 7 | 150 (90) | 950 | Caroline Islands, Marshall Islands | None | None | |
| 29W | October 31 – November 2 | 45 (30) | 1004 | None | None | None |
November
[edit]
| Storm name | Dates active | Max wind km/h (mph) |
Pressure (hPa) |
Areas affected | Damage (USD) |
Deaths | Refs |
|---|---|---|---|---|---|---|---|
| BOB 06 | November 3–7 | 85 (50) | 998 | None | None | None | |
| TD | November 10–11 | 1008 | Philippines | None | None | ||
| BOB 07 | November 10–17 | 100 (65) | 988 | Sri Lanka, India | $69 million | 263 | |
| Forrest | November 13–22 | 185 (115) | 952 | Bangladesh, Myanmar, Thailand | Unknown | 2 | |
| Gay (Seniang) | November 14–29 | 205 (125) | 900 | Marshall Islands, Caroline Islands, Mariana Islands, Guam, Japan, Aleutian Islands | None | 1 | |
| Hunt | November 15–21 | 165 (105) | 940 | Mariana Islands | None | None | |
| Three-C | November 22–23 | 55 (35) | 1008 | None | None | None | |
| ARB 03 | November 30 – December 3 | 45 (30) | 987 | None | None | None |
December
[edit]
| Storm name | Dates active | Max wind km/h (mph) |
Pressure (hPa) |
Areas affected | Damage (USD) |
Deaths | Refs |
|---|---|---|---|---|---|---|---|
| Joni | December 3–13 | 165 (105) | 940 | Tuvalu, Fiji | $1 million | 1 | |
| ARB 04 | December 20–24 | 55 (35) | 1002 | Somalia | None | None | |
| Nina | December 21, 1992 – January 5, 1993 | 140 (85) | 960 | Queensland, Solomon Islands, Rotuma, Wallis and Futuna, Tuvalu, Tonga, Niue | $110 million | 26 | |
| Kina | December 26, 1992 – January 5, 1993 | 150 (90) | 955 | Fiji, Tonga | $110 million | 26 |
Global effects
[edit]There are a total of nine tropical cyclone basins, seven are seasonal and two are non-seasonal, thus all eight basins except the Mediterranean are active. In this table, data from all these basins are added.
See also
[edit]Notes
[edit]- ^ a b The wind speeds for this tropical cyclone/basin are based on the Saffir Simpson Scale which uses 1-minute sustained winds.
- ^ a b c d Only systems that formed either before or on December 31, 1992 are counted in the seasonal totals.
- ^ The wind speeds for this tropical cyclone/basin are based on the IMD Scale which uses 3-minute sustained winds.
- ^ a b c Only systems that formed either on or after January 1, 1992 are counted in the seasonal totals.
- ^ The wind speeds for this tropical cyclone are based on Météo-France, which uses wind gusts.
- ^ The sum of the number of systems in each basin will not equal the number shown as the total. This is because when systems move between basins, it creates a discrepancy in the actual number of systems.
- ^ The number in the bracket indicates indirect deaths.
References
[edit]- ^ "Global statistics compared with climatology". Colorado State University. 2023.
- ^ "In The Nation". The Baltimore Sun. June 1, 1992. Archived from the original on July 16, 2012. Retrieved November 17, 2011.
- ^ a b c d Cite error: The named reference
mwrwas invoked but never defined (see the help page). - ^ Background information: the North Atlantic hurricane season (Report). Climate Prediction Center. May 2012. Retrieved August 25, 2021.
- ^ a b Richard Pasch; Lixion Avila (March 1994). "Atlantic Tropical Systems of 1992". Monthly Weather Review. 122 (3). National Hurricane Center: 539–548. Bibcode:1994MWRv..122..539P. doi:10.1175/1520-0493(1994)122<0539:ATSO>2.0.CO;2.
- ^ Cite error: The named reference
annamariawas invoked but never defined (see the help page). - ^ Cite error: The named reference
spt626was invoked but never defined (see the help page). - ^ Cite error: The named reference
mh627was invoked but never defined (see the help page). - ^ "1992 Annual Tropical Cyclone Report" (PDF). Joint Typhoon Warning Center. Archived from the original (PDF) on 2012-09-15. Retrieved 2011-11-28.
- ^ Cite error: The named reference
nccaneswas invoked but never defined (see the help page). - ^ Neal Dorst (January 21, 2010). Subject: G1) When is hurricane season? (Report). Hurricane Research Division. Archived from the original on July 8, 2018. Retrieved August 25, 2021.
- ^ a b c "Atlantic hurricane best track (HURDAT version 2)" (Database). United States National Hurricane Center. May 11, 2024. Retrieved March 6, 2025.
 This article incorporates text from this source, which is in the public domain.
- Landsea, Chris (April 2022). "The revised Atlantic hurricane database (HURDAT2) - Chris Landsea – April 2022" (PDF). Hurricane Research Division – NOAA/AOML. Miami: Hurricane Research Division – via Atlantic Oceanographic and Meteorological Laboratory.
- ^ Atlantic basin Comparison of Original and Revised HURDAT. Hurricane Research Division; Atlantic Oceanographic and Meteorological Laboratory (Report). Miami, Florida: National Oceanic and Atmospheric Administration. June 2019. Retrieved August 25, 2021.
- ^ a b c d "The 1992 Central Pacific Tropical Cyclone Season". Central Pacific Hurricane Center. July 5, 2007. Archived from the original on June 14, 2009. Retrieved June 7, 2009.
- ^ Lawrence, Miles B.; Rappaport, Edward N. (March 4, 1994). "Eastern North Pacific Hurricane Season of 1992". Monthly Weather Review. 122 (3). Boston: American Meteorological Society: 549–558. Bibcode:1994MWRv..122..549L. doi:10.1175/1520-0493(1994)122<0549:ENPHSO>2.0.CO;2. Retrieved January 15, 2024.
- ^ a b National Hurricane Center; Hurricane Research Division; Central Pacific Hurricane Center (April 26, 2024). "The Northeast and North Central Pacific hurricane database 1949–2023". United States National Oceanic and Atmospheric Administration's National Weather Service. Archived from the original on May 29, 2024. A guide on how to read the database is available here. This article incorporates text from this source, which is in the public domain.
- ^ "Basin Archives: Northeast Pacific Ocean Historical Tropical Cyclone Statistics". Fort Collins, Colorado: Colorado State University. Retrieved July 8, 2022.
- ^ "Basin Archives: Northwest Pacific Ocean Historical Tropical Cyclone Statistics". Fort Collins, Colorado: Colorado State University. Retrieved 21 June 2023.
- ^ a b "North Indian Ocean Tropical Cyclones" (PDF). Annual Tropical Cyclone Report. Joint Typhoon Warning Center (Report). United states Navy. 1993. pp. 155–157. Archived from the original (PDF) on September 28, 2012. Retrieved May 28, 2014.
- ^ a b "IMD Best track data 1982-2022" (xls). India Meteorological Department. A guide on how to read the database is available here.
- ^ "What are the average, most, and least tropical cyclones occurring in this basin?". Frequently Asked Questions on Tropical Cyclones (Report). India Meteorological Department. Archived from the original on May 21, 2015. Retrieved May 28, 2014.
- ^ a b Longshore, David (2009). Encyclopedia of Hurricanes, Typhoons, and Cyclones, New Edition. Infobase Publishing. p. 333. ISBN 978-1-4381-1879-6.
- ^ a b Chang, C. P.; Erickson, J. E.; Lau, K. M. "Northeasterly Cold Surges and Near-Equatorial Disturbances over the Winter MONEX Area during December 1974. Part I: Synoptic Aspects". American Meteorological Society. Archived from the original on January 17, 2013. Retrieved February 14, 2025.
- ^ a b c Cite error: The named reference
BOM databasewas invoked but never defined (see the help page). - ^ Joint Typhoon Warning Center; Naval Western Oceanography Center (1993). 6. Tropical Cyclone Warning Verification Statistics: Southern Hemisphere (PDF) (1992 Annual Tropical Cyclone Report). United States Navy, United States Airforce. pp. 240–247. Archived (PDF) from the original on September 15, 2012. Retrieved March 25, 2013.
- ^ Levin, Michael; Harrington, Andrew (2016). Migration in the Federated States of Micronesia: A COUNTRY PROFILE 2015 (PDF). Geneva, Switzerland: International Organization for Migration. p. 92.
- ^ Stremler, David J; Joint Typhoon Warning Center; Naval Western Oceanography Center (1993). Typhoon Axel (01W) (PDF) (1992 Annual Tropical Cyclone Report). United States Navy, United States Airforce. pp. 36–41. Archived (PDF) from the original on September 15, 2012. Retrieved September 8, 2013.
- ^ Tropical Cyclone Betsy, January 4 – 15, 1992 (Tropical Cyclone Report). Fiji Meteorological Service. Archived from the original on April 28, 2013. Retrieved September 8, 2013.
- ^ Brisbane Tropical Cyclone Warning Center. Tropical Cyclone Mark (Report). Australian: Bureau of Meteorology. Retrieved 15 August 2012.
- ^ Mundell (1993). "Tropical Storm Ekeka (01C)" (PDF). Joint Typhoon Warning Center. Archived from the original (PDF) on 2011-06-07. Retrieved 2008-09-20.
- ^ Kenneth R. Knapp; Michael C. Kruk; David H. Levinson; Howard J. Diamond; Charles J. Neumann (2010). 1992 Celesta (1992039S14063). The International Best Track Archive for Climate Stewardship (IBTrACS): Unifying tropical cyclone best track data (Report). Bulletin of the American Meteorological Society. Archived from the original on 2016-03-05. Retrieved 2014-01-01.
- ^ Brisbane Tropical Cyclone Warning Center. Tropical Cyclone Daman (Report). Australian: Bureau of Meteorology. Archived from the original on 18 March 2012. Retrieved 18 March 2012.
- ^ Kenneth R. Knapp; Michael C. Kruk; David H. Levinson; Howard J. Diamond; Charles J. Neumann (2010). 1992 Davilia (1992048S18067). The International Best Track Archive for Climate Stewardship (IBTrACS): Unifying tropical cyclone best track data (Report). Bulletin of the American Meteorological Society. Archived from the original on 2016-01-22. Retrieved 2014-01-01.
- ^ Joint Typhoon Warning Center; Naval Pacific Meteorology and Oceanography Center. "Tropical Cyclone 18P best track analysis". United States Navy, United States Air Force. Retrieved 6 January 2013.
- ^ Darwin Regional Specialised Meteorological Centre (1992). "February 1992" (PDF). Darwin Tropical Diagnostic Statement. 11 (3). Australian Bureau of Meteorology: 2–3. ISSN 1321-4233. Retrieved 6 January 2013.
- ^ Kenneth R. Knapp; Michael C. Kruk; David H. Levinson; Howard J. Diamond; Charles J. Neumann (2010). 1992 Elizabeta:Elizabetha (1992054S14044). The International Best Track Archive for Climate Stewardship (IBTrACS): Unifying tropical cyclone best track data (Report). Bulletin of the American Meteorological Society. Archived from the original on 2016-01-22. Retrieved 2014-01-01.
- ^ Kenneth R. Knapp; Michael C. Kruk; David H. Levinson; Howard J. Diamond; Charles J. Neumann (2010). 1992 Farida (1992055S11086). The International Best Track Archive for Climate Stewardship (IBTrACS): Unifying tropical cyclone best track data (Report). Bulletin of the American Meteorological Society. Archived from the original on 2015-12-22. Retrieved 2014-01-01.
- ^ "Severe Tropical Cyclone Harriet". Australian Bureau of Meteorology. Retrieved 14 August 2012.
- ^ Kenneth R. Knapp; Michael C. Kruk; David H. Levinson; Howard J. Diamond; Charles J. Neumann (2010). 1992 Harriet:Harriet_Heat:Heather (1992056S11102). The International Best Track Archive for Climate Stewardship (IBTrACS): Unifying tropical cyclone best track data (Report). Bulletin of the American Meteorological Society. Archived from the original on 2015-12-22. Retrieved 2014-01-01.
- ^ Tropical Cyclone Esau, February 24 - March 7 (Tropical Cyclone Report). Fiji Meteorological Service. Archived from the original on 22 April 2013. Retrieved 7 November 2018.
- ^ Joint Typhoon Warning Center; Naval Pacific Meteorology and Oceanography Center. Tropical Cyclone 21P (Esau) best track analysis (Report). United States Navy, United States Air Force. Retrieved 10 May 2013.
- ^ Kenneth R. Knapp; Michael C. Kruk; David H. Levinson; Howard J. Diamond; Charles J. Neumann (2010). 1992 Gerda (1992055S17053). The International Best Track Archive for Climate Stewardship (IBTrACS): Unifying tropical cyclone best track data (Report). Bulletin of the American Meteorological Society. Archived from the original on 2015-12-22. Retrieved 2014-01-01.
- ^ Kenneth R. Knapp; Michael C. Kruk; David H. Levinson; Howard J. Diamond; Charles J. Neumann (2010). 1992 H19192 (1992057S17052). The International Best Track Archive for Climate Stewardship (IBTrACS): Unifying tropical cyclone best track data (Report). Bulletin of the American Meteorological Society. Archived from the original on 2016-01-21. Retrieved 2014-01-01.
- ^ "Severe Tropical Cyclone Ian". Australian Bureau of Meteorology. Retrieved 14 August 2012.
- ^ "1992 Tropical Cyclone FRAN (1992064S10184)". International Best Track Archive for Climate Stewardship. Retrieved April 15, 2019.
- ^ Tropical Cyclone Fran (Report). Australian Bureau of Meteorology. Archived from the original on November 29, 2014. Retrieved May 21, 2019.
- ^ Tropical Cyclone Fran, March 9–17 (Tropical Cyclone Report). Fiji Meteorological Service. May 20, 1996. Archived from the original on May 8, 2013. Retrieved May 8, 2013.
- ^ "1992 Tropical Cyclone Hettie (1992084S10212)". The International Best Track Archive for Climate Stewardship. Archived from the original on April 11, 2023. Retrieved September 22, 2021.
- ^ a b c Cite error: The named reference
aprwas invoked but never defined (see the help page). - ^ Cite error: The named reference
JMA BTwas invoked but never defined (see the help page). - ^ Beven, John L (April 20, 1992). "Tropical Cyclone Weekly Summary #36". Archived from the original on November 8, 2012. Retrieved January 30, 2015.
- ^ "Severe Tropical Cyclone Neville". Australian Bureau of Meteorology. Retrieved 14 August 2012.
- ^ "Severe Tropical Cyclone Jane". Australian Bureau of Meteorology. Retrieved 14 August 2012.
- ^ Kenneth R. Knapp; Michael C. Kruk; David H. Levinson; Howard J. Diamond; Charles J. Neumann (2010). 1992 Irna:Jane:Jane_Irna (1992096S05101). The International Best Track Archive for Climate Stewardship (IBTrACS): Unifying tropical cyclone best track data (Report). Bulletin of the American Meteorological Society. Archived from the original on 2015-12-22. Retrieved 2014-01-01.
- ^ National Hurricane Center (1992). "Subtropical Storm One Preliminary Report (Page 2)". Retrieved August 21, 2007.
- ^ Tropical Cyclone Innis, April 27 – May 3 (Report). Fiji Meteorological Service. Archived from the original on April 17, 2022. Retrieved April 20, 2023.
- ^ "1992 Tropical Cyclone Innis (1992118S11179)". The International Best Track Archive for Climate Stewardship. Archived from the original on November 14, 2022. Retrieved April 20, 2023.
- ^ Dorst, Neal (June 2, 2016). "TCFAQ G1) When is hurricane season?". Atlantic Oceanographic and Meteorological Laboratory. Archived from the original on May 6, 2009. Retrieved July 27, 2022.
- ^ "27 killed by heavy storm in western Burma". Bangkok, Thailand. Agence France-Presse. May 26, 1992. – via Lexis Nexis (subscription required)
- ^ "Storm kills 27 persons in western Myanmar state". Yangon, Myanmar. Xinhua General News. May 27, 1992. – via Lexis Nexis (subscription required)
- ^ Miles B. Lawrence (1992-06-28). "Tropical Storm Agatha Preliminary Report". National Hurricane Center. Retrieved 2011-03-11.
- ^ Lixion A. Avila (August 8, 1992). "Tropical Storm Blas Preliminary Report". National Hurricane Center. Retrieved August 18, 2007.
- ^ Richard J. Pasch (December 2, 1992). "Hurricane Celia Preliminary Report – Page 1". National Hurricane Center. Retrieved August 18, 2007.
- ^ "Digital Typhoon: Typhoon 199203 (BOBBIE) - Disaster Information". Digital Typhoon. KITAMOTO Asanobu @ National Institute of Informatics. Archived from the original on 28 August 2024. Retrieved 26 August 2024.
External links
[edit]| Tropical cyclone year articles (1990–1999) |
|---|
| 1990, 1991, 1992, 1993, 1994, 1995, 1996, 1997, 1998, 1999 |
Regional Specialized Meteorological Centers
- US National Hurricane Center – North Atlantic, Eastern Pacific
- Central Pacific Hurricane Center – Central Pacific
- Japan Meteorological Agency – NW Pacific
- India Meteorological Department – Bay of Bengal and the Arabian Sea
- Météo-France – La Reunion – South Indian Ocean from 30°E to 90°E
- Fiji Meteorological Service – South Pacific west of 160°E, north of 25° S
Tropical Cyclone Warning Centers
- Meteorology, Climatology, and Geophysical Agency of Indonesia – South Indian Ocean from 90°E to 141°E, generally north of 10°S
- Australian Bureau of Meteorology (TCWC's Perth, Darwin & Brisbane) – South Indian Ocean & South Pacific Ocean from 90°E to 160°E, generally south of 10°S
- Papua New Guinea National Weather Service – South Pacific Ocean from 141°E to 160°E, generally north of 10°S
- Meteorological Service of New Zealand Limited – South Pacific west of 160°E, south of 25°S
![]() This article incorporates public domain material from websites or documents of the National Weather Service.
This article incorporates public domain material from websites or documents of the National Weather Service.