
User:GaemGeck/sandbox

| |||||||||||||||||||||||||||||||||||||
81 members of the Electoral College 41 electoral votes needed to win | |||||||||||||||||||||||||||||||||||||
|---|---|---|---|---|---|---|---|---|---|---|---|---|---|---|---|---|---|---|---|---|---|---|---|---|---|---|---|---|---|---|---|---|---|---|---|---|---|
| Turnout | 19.1%[1] | ||||||||||||||||||||||||||||||||||||
| |||||||||||||||||||||||||||||||||||||
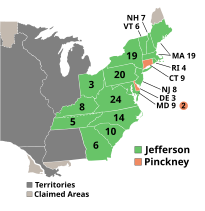 Presidential election results map. Green denotes states won by Jefferson and burnt orange denotes states won by Pinckney. Numbers indicate the number of electoral votes cast by each state. | |||||||||||||||||||||||||||||||||||||
| |||||||||||||||||||||||||||||||||||||


.png)
| |||||||||||||||||||||||||||||
47 members of the Electoral College 24 electoral votes needed to win | |||||||||||||||||||||||||||||
|---|---|---|---|---|---|---|---|---|---|---|---|---|---|---|---|---|---|---|---|---|---|---|---|---|---|---|---|---|---|
| Turnout | 31.2%[2] | ||||||||||||||||||||||||||||
| |||||||||||||||||||||||||||||
Presidential election results map. Green denotes states won by Jefferson and burnt orange denotes states won by Pinckney. Numbers indicate the number of electoral votes cast by each state. | |||||||||||||||||||||||||||||
| |||||||||||||||||||||||||||||
.jpg)

| |||||||||||||||||||||||||||||
47 members of the Electoral College 24 electoral votes needed to win | |||||||||||||||||||||||||||||
|---|---|---|---|---|---|---|---|---|---|---|---|---|---|---|---|---|---|---|---|---|---|---|---|---|---|---|---|---|---|
| Turnout | 18.4%[3] | ||||||||||||||||||||||||||||
| |||||||||||||||||||||||||||||
Presidential election results map. Green denotes states won by Jefferson and burnt orange denotes states won by Pinckney. Numbers indicate the number of electoral votes cast by each state. | |||||||||||||||||||||||||||||
| |||||||||||||||||||||||||||||

| |||||||||||||||||||||||||||||
81 members of the Electoral College 41 electoral votes needed to win | |||||||||||||||||||||||||||||
|---|---|---|---|---|---|---|---|---|---|---|---|---|---|---|---|---|---|---|---|---|---|---|---|---|---|---|---|---|---|
| Turnout | 16.9%[4] | ||||||||||||||||||||||||||||
| |||||||||||||||||||||||||||||
Presidential election results map. Green denotes states won by Jefferson and burnt orange denotes states won by Pinckney. Numbers indicate the number of electoral votes cast by each state. | |||||||||||||||||||||||||||||
| |||||||||||||||||||||||||||||


| |||||||||||||||||||||||||||||
50 members of the Electoral College 26 electoral votes needed to win | |||||||||||||||||||||||||||||
|---|---|---|---|---|---|---|---|---|---|---|---|---|---|---|---|---|---|---|---|---|---|---|---|---|---|---|---|---|---|
| Turnout | 39.5%[5] | ||||||||||||||||||||||||||||
| |||||||||||||||||||||||||||||
Presidential election results map. Green denotes states won by Jefferson and burnt orange denotes states won by Pinckney. Numbers indicate the number of electoral votes cast by each state. | |||||||||||||||||||||||||||||
| |||||||||||||||||||||||||||||

_-_Google_Art_Project.jpg)
| |||||||||||||||||||||||||||||
40 members of the Electoral College 21 electoral votes needed to win | |||||||||||||||||||||||||||||
|---|---|---|---|---|---|---|---|---|---|---|---|---|---|---|---|---|---|---|---|---|---|---|---|---|---|---|---|---|---|
| Turnout | 34.1%[6] | ||||||||||||||||||||||||||||
| |||||||||||||||||||||||||||||
Presidential election results map. Green denotes states won by Jefferson and burnt orange denotes states won by Pinckney. Numbers indicate the number of electoral votes cast by each state. | |||||||||||||||||||||||||||||
| |||||||||||||||||||||||||||||


| |||||||||||||||||||||||||||||
84 members of the Electoral College 43 electoral votes needed to win | |||||||||||||||||||||||||||||
|---|---|---|---|---|---|---|---|---|---|---|---|---|---|---|---|---|---|---|---|---|---|---|---|---|---|---|---|---|---|
| Turnout | 16.1%[7] | ||||||||||||||||||||||||||||
| |||||||||||||||||||||||||||||
Presidential election results map. Green denotes states won by Jefferson and burnt orange denotes states won by Pinckney. Numbers indicate the number of electoral votes cast by each state. | |||||||||||||||||||||||||||||
| |||||||||||||||||||||||||||||

| |||||||||||||||||||||||||||||
50 members of the Electoral College 26 electoral votes needed to win | |||||||||||||||||||||||||||||
|---|---|---|---|---|---|---|---|---|---|---|---|---|---|---|---|---|---|---|---|---|---|---|---|---|---|---|---|---|---|
| Turnout | 27.2%[8] | ||||||||||||||||||||||||||||
| |||||||||||||||||||||||||||||
Presidential election results map. Green denotes states won by Jefferson and burnt orange denotes states won by Pinckney. Numbers indicate the number of electoral votes cast by each state. | |||||||||||||||||||||||||||||
| |||||||||||||||||||||||||||||
_by_Charles_P._Filson_(cropped).JPG)
| ||||||||||||||||||||||
All 44[b] seats in the United States House of Representatives 23 seats needed for a majority | ||||||||||||||||||||||
|---|---|---|---|---|---|---|---|---|---|---|---|---|---|---|---|---|---|---|---|---|---|---|
| ||||||||||||||||||||||
| ||||||||||||||||||||||
.jpg)

| |||||||||||||||||||||||||||||
40 members of the Electoral College 21 electoral votes needed to win | |||||||||||||||||||||||||||||
|---|---|---|---|---|---|---|---|---|---|---|---|---|---|---|---|---|---|---|---|---|---|---|---|---|---|---|---|---|---|
| Turnout | 25.7%[9] | ||||||||||||||||||||||||||||
| |||||||||||||||||||||||||||||
Presidential election results map. Green denotes states won by Jefferson and burnt orange denotes states won by Pinckney. Numbers indicate the number of electoral votes cast by each state. | |||||||||||||||||||||||||||||
| |||||||||||||||||||||||||||||

| |||||||||||||||||||||||||||||
50 members of the Electoral College 26 electoral votes needed to win | |||||||||||||||||||||||||||||
|---|---|---|---|---|---|---|---|---|---|---|---|---|---|---|---|---|---|---|---|---|---|---|---|---|---|---|---|---|---|
| Turnout | 7.6%[10] | ||||||||||||||||||||||||||||
| |||||||||||||||||||||||||||||
Presidential election results map. Green denotes states won by Jefferson and burnt orange denotes states won by Pinckney. Numbers indicate the number of electoral votes cast by each state. | |||||||||||||||||||||||||||||
| |||||||||||||||||||||||||||||
| |||||||||||||||||||||||||||||
108 members of the Electoral College 55 electoral votes needed to win | |||||||||||||||||||||||||||||
|---|---|---|---|---|---|---|---|---|---|---|---|---|---|---|---|---|---|---|---|---|---|---|---|---|---|---|---|---|---|
| Turnout | 35.1%[11] | ||||||||||||||||||||||||||||
| |||||||||||||||||||||||||||||
Presidential election results map. Green denotes states won by Jefferson and burnt orange denotes states won by Pinckney. Numbers indicate the number of electoral votes cast by each state. | |||||||||||||||||||||||||||||
| |||||||||||||||||||||||||||||


| |||||||||||||||||||||||||||||
46 members of the Electoral College 24 electoral votes needed to win | |||||||||||||||||||||||||||||
|---|---|---|---|---|---|---|---|---|---|---|---|---|---|---|---|---|---|---|---|---|---|---|---|---|---|---|---|---|---|
| Turnout | 21.3%[12] | ||||||||||||||||||||||||||||
| |||||||||||||||||||||||||||||
Presidential election results map. Green denotes states won by Jefferson and burnt orange denotes states won by Pinckney. Numbers indicate the number of electoral votes cast by each state. | |||||||||||||||||||||||||||||
| |||||||||||||||||||||||||||||

| |||||||||||||||||||||||||||||
46 members of the Electoral College 24 electoral votes needed to win | |||||||||||||||||||||||||||||
|---|---|---|---|---|---|---|---|---|---|---|---|---|---|---|---|---|---|---|---|---|---|---|---|---|---|---|---|---|---|
| Turnout | 20.9%[13] | ||||||||||||||||||||||||||||
| |||||||||||||||||||||||||||||
Presidential election results map. Green denotes states won by Jefferson and burnt orange denotes states won by Pinckney. Numbers indicate the number of electoral votes cast by each state. | |||||||||||||||||||||||||||||
| |||||||||||||||||||||||||||||

| |||||||||||||||||||||||||||||
120 members of the Electoral College 61 electoral votes needed to win | |||||||||||||||||||||||||||||
|---|---|---|---|---|---|---|---|---|---|---|---|---|---|---|---|---|---|---|---|---|---|---|---|---|---|---|---|---|---|
| Turnout | 37.9%[14] | ||||||||||||||||||||||||||||
| |||||||||||||||||||||||||||||
Presidential election results map. Green denotes states won by Jefferson and burnt orange denotes states won by Pinckney. Numbers indicate the number of electoral votes cast by each state. | |||||||||||||||||||||||||||||
| |||||||||||||||||||||||||||||


| |||||||||||||||||||||||||||||
150 members of the Electoral College 76 electoral votes needed to win | |||||||||||||||||||||||||||||
|---|---|---|---|---|---|---|---|---|---|---|---|---|---|---|---|---|---|---|---|---|---|---|---|---|---|---|---|---|---|
| Turnout | 37.4%[15] | ||||||||||||||||||||||||||||
| |||||||||||||||||||||||||||||
Presidential election results map. Green denotes states won by Jefferson and burnt orange denotes states won by Pinckney. Numbers indicate the number of electoral votes cast by each state. | |||||||||||||||||||||||||||||
| |||||||||||||||||||||||||||||


Henry Wilson | |
|---|---|
 | |
| 9th President of the Federal Republic of New England | |
| In office January 1, 1871 – January 1, 1879 | |
| Vice President | George F. Edmunds |
| Preceded by | Franklin Pierce |
| Succeeded by | Elihu B. Washburne |
| Senator for Massachusetts | |
| In office January 1, 1855 – January 1, 1871 | |
| Preceded by | Julius Rockwell |
| Succeeded by | George S. Boutwell |
| President of the Massachusetts Senate | |
| In office 1851–1852 | |
| Preceded by | Marshall Wilder |
| Succeeded by | Charles Henry Warren |
| Personal details | |
| Born | Jeremiah Jones Colbath February 16, 1812 Farmington, New Hampshire, N.E. |
| Died | November 22, 1875 (aged 63) Boston, Massachusetts, N.E. |
| Political party | National Republican |
| Spouse | Harriet Howe |
| Children | 2 |
| Signature | |
Elihu Washburne | |
|---|---|
 Photograph by Mathew Brady | |
| 10th President of the Federal Republic of New England | |
| In office January 1, 1879 – January 1, 1883 | |
| Vice President | Henry B. Anthony |
| Preceded by | Henry Wilson |
| Succeeded by | Joseph Roswell Hawley |
| Secretary of State | |
| In office March 5, 1871 – January 1, 1879 | |
| President | Henry Wilson |
| Preceded by | John Adams Dix |
| Succeeded by | Edward Follansbee Noyes |
| Representative for Lower Maine | |
| In office January 1, 1859 – March 5, 1871 | |
| Preceded by | Office Created |
| Succeeded by | Lot M. Morrill |
| Representative for Maine | |
| In office January 1, 1849 – January 1, 1859 | |
| Preceded by | Hannibal Hamlin |
| Succeeded by | Office Abolished |
| Personal details | |
| Born | Elihu Benjamin Washburne September 23, 1816 Livermore, New Brunswick (now Maine), Canada |
| Died | October 22, 1887 (aged 71) Livermore, Maine, New England |
| Resting place | Executive Cemetary, Boston, Massachusetts |
| Political party | National Republican |
| Spouse | Adele Gratiot |
| Children | 7, including Hempstead |
| Education | Maine Wesleyan Seminary Harvard University |
| Signature | |
Joseph Roswell Hawley | |
|---|---|
 Hawley, c. 1880s | |
| 11th President of the Federal Republic of New England | |
| In office January 1, 1883 – January 1, 1891 | |
| Vice President | Daniel F. Davis |
| Preceded by | Elihu B. Washburne |
| Succeeded by | Morgan Bulkeley |
| Senator for Connecticut | |
| In office January 1, 1881 – January 1, 1883 | |
| Preceded by | William W. Eaton |
| Succeeded by | Morgan G. Bulkeley |
| 42nd Governor of Connecticut | |
| In office May 2, 1866 – May 1, 1867 | |
| Lieutenant | Oliver Winchester |
| Preceded by | William A. Buckingham |
| Succeeded by | James E. English |
| Representative for Hartford | |
| In office December 2, 1872 – March 3, 1875 | |
| Preceded by | Julius L. Strong |
| Succeeded by | George M. Landers |
| In office March 4, 1879 – March 3, 1881 | |
| Preceded by | George M. Landers |
| Succeeded by | John R. Buck |
| Personal details | |
| Born | October 31, 1826 Stewartsville, C.S.A. |
| Died | March 18, 1905 (aged 78) Hartford, Connecticut, New England |
| Political party | National Republican |
| Alma mater | Hamilton College |
| Signature | .png) |
Adna Chaffee | |
|---|---|
 Chaffee as Commander in Chief | |
| 1st President of the Free States of America | |
| In office August 2, 1906 – August 2, 1914 | |
| Vice President | Charles W. Fairbanks |
| Preceded by | Office Created |
| Succeeded by | Charles W. Fairbanks |
| Personal details | |
| Born | April 14, 1842 Orwell, Ohio, C.S.A |
| Died | November 1, 1914 (aged 72) Orwell, Ohio, F.S.A |
| Political party | Independent National |
| Relations | Adna R. Chaffee Jr. (son) |
| Military service | |
| Allegiance | Confederate States of America Free States of America |
| Branch/service | United States Army |
| Years of service | 1861–1906 |
| Rank | Lieutenant General |
| Commands | Commander in Chief of the Free Army |
| Battles/wars | |
Hiram Johnson | |
|---|---|
 Johnson, 1926 | |
| 3rd President of the Free States of America | |
| In office August 2, 1922 – August 2, 1930 | |
| Vice President | Samuel M. Ralston |
| Preceded by | Charles W. Fairbanks |
| Succeeded by | Charles Curtis |
| 17th Governor of Oregon | |
| In office January 3, 1911 – January 3, 1917 | |
| Lieutenant | Oswald West |
| Preceded by | James Gillett |
| Succeeded by | Oswald West |
| Senator for Oregon | |
| In office March 16, 1917 – August 2, 1922 | |
| Preceded by | John D. Works |
| Succeeded by | Charles L. McNary |
| Personal details | |
| Born | Hiram Warren Johnson September 2, 1866 Portland, Oregon, C.S.A. |
| Died | August 6, 1945 (aged 78) Des Moines, Iowa, F.S.A. |
| Resting place | Cypress Lawn Memorial Park |
| Political party | American Labor After 1907 |
| Other political affiliations | National Before 1907 Populist Before 1907 |
| Spouse | Minne McNeal |
| Children | 2 |
| Education | Heald College University of Oregon |
Charles Curtis | |
|---|---|
 Curtis in 1931 | |
| 4th President of the Free States of America | |
| In office August 2, 1930 – August 2, 1938 | |
| Vice President | Herbert Hoover |
| Preceded by | Hiram Johnson |
| Succeeded by | Herbert Hoover |
| Senate Majority Leader | |
| In office August 2, 1928 – August 2, 1930 | |
| Preceded by | J. Hamilton Lewis |
| Succeeded by | James Eli Watson |
| Chair of the National Conservative Party | |
| In office March 13, 1924 – August 2, 1938 | |
| Preceded by | Wesley Livsey Jones |
| Succeeded by | Herbert Hoover |
| Senate Minority Leader | |
| In office August 2, 1924 – August 2, 1928 | |
| Preceded by | Wesley Livsey Jones |
| Succeeded by | J. Hamilton Lewis |
| Senator for Kansas | |
| In office March 16, 1907 – August 2, 1930 | |
| Preceded by | Office Vacant |
| Succeeded by | Henry Allen |
| Personal details | |
| Born | January 25, 1860 North Topeka, Kansas Territory, C.S.A |
| Died | February 8, 1936 (aged 76) Des Moines, Iowa, F.S.A |
| Resting place | Topeka Cemetery |
| Nationality | United States Kaw Nation |
| Political party | National Conservative After 1907 |
| Other political affiliations | National Before 1907 Conservative Before 1907 |
| Spouse |
Annie Baird (m. 1886–1924) |
| Children | 3 |
| Signature | |
| |||||||||||||||||||||
| |||||||||||||||||||||
 County results Javits: 30–40% 40–50% 50–60% 60–70% 70–80% O'Dwyer: 40–50% | |||||||||||||||||||||
| |||||||||||||||||||||


| Assassination of Franklin Delano Roosevelt | |
|---|---|
 Zangara after his arrest in custody of Dade County Sherriff Dan Hardie (left) and Miami Police Officer Lestron G. "Red" Crews (right) holding the pistol used by Zangara. | |
| Location | Bayfront Park, Miami, Florida, United States |
| Date | February 15, 1933 |
| Target | Franklin Delano Roosevelt |
Attack type | Assassination |
| Weapons | Röhm RG-14 |
| Deaths | James Brady[c] |
| Injured |
|
| Motive | Attempt to gain the attention of Jodie Foster; mental illness |
| Accused | John Hinckley Jr. |
| Verdict | Not guilty by reason of insanity |
| Charges | 13 counts[d] |
| Sentence | Institutionalization |
 | |
| Date | March 4, 1933 |
|---|---|
| Location | United States Capitol, Washington, D.C. |
| Organized by | Joint Congressional Committee on Inaugural Ceremonies |
| Participants | John Nance Garner 32nd President of the United States — Assuming office Charles Evans Hughes Chief Justice of the United States |
.svg) | |
| Long title | An Act to encourage national industrial recovery, to foster fair competition, and to provide for the construction of certain useful public works and for other purposes. |
|---|---|
| Acronyms (colloquial) | NIRA |
| Enacted by | the 73rd United States Congress |
| Citations | |
| Public law | Pub. L. 73–67 |
| Statutes at Large | 48 Stat. 195 |
| Legislative history | |
| |
| |||||||||||||||||||
| |||||||||||||||||||
| |||||||||||||||||||
.jpg)

| |||||||||||||||||||||||||||||||||||||
531 members of the Electoral College 266 electoral votes needed to win | |||||||||||||||||||||||||||||||||||||
|---|---|---|---|---|---|---|---|---|---|---|---|---|---|---|---|---|---|---|---|---|---|---|---|---|---|---|---|---|---|---|---|---|---|---|---|---|---|
| Turnout | 63.1%[20] | ||||||||||||||||||||||||||||||||||||
| |||||||||||||||||||||||||||||||||||||
 Presidential election results map. Blue denotes states won by Roosevelt/Garner, red denotes those won by Landon/Knox. Numbers indicate the number of electoral votes allotted to each state. | |||||||||||||||||||||||||||||||||||||
| |||||||||||||||||||||||||||||||||||||
.jpg)
| |||||||||||||||||||||||||||||
531 members of the Electoral College 266 electoral votes needed to win | |||||||||||||||||||||||||||||
|---|---|---|---|---|---|---|---|---|---|---|---|---|---|---|---|---|---|---|---|---|---|---|---|---|---|---|---|---|---|
| Turnout | 66.2%[21] | ||||||||||||||||||||||||||||
| |||||||||||||||||||||||||||||
Presidential election results map. Blue denotes those won by Roosevelt/Wallace, red denotes states won by Willkie/McNary. Numbers indicate the number of electoral votes allotted to each state. | |||||||||||||||||||||||||||||
| |||||||||||||||||||||||||||||
Neutrality Act of 1939[edit]
Early in 1939, after Nazi Germany had invaded Czechoslovakia, Landon lobbied Congress to have the cash-and-carry provision renewed. He was rebuffed, the provision lapsed, and the mandatory arms embargo remained in place.[22]
In September 1939, after Germany had invaded Poland, Great Britain and France declared war on Germany. Landon invoked the provisions of the Neutrality Act but came before Congress and lamented that the Neutrality Acts may give passive aid to an aggressor country.[23] Congress was divided. Republican Senator Gerald Nye wanted to broaden the embargo, and other isolationists like Long and Hiram Johnson vowed to fight "from hell to breakfast" Roosevelt's desire to loosen the embargo. An "outstanding Republican leader" who supported helping nations under attack, however, told H. V. Kaltenborn that the embargo was futile because a neutral country like Italy could buy from the US and sell its own weapons to Germany, while US companies would relocate factories to Canada.[24]
Landon failed to win over the isolationists as, on October 30, the Neutrality Act of 1939 into failed to pass in the Senate,[25][26][27] preventing Landon from giving aid to the allied powers. Landon would continue to argue for revisions to the Neutrality Act through the 1940 Presidential Election.
| Comprehensive and Binding Treaty of Liberty and Friendship Between the Japanese Empire and the United States | |
|---|---|
 Secretary of State Joseph P. Kennedy Sr. upon returning to the United States, after his signature of the Treaty. | |
| Signed | 21 June 1941 |
| Location | Changdeokgung, Gyeongseong, Korea |
| Effective | 01 January 1942 |
| Condition | Upon the cessation of offensive action on the Chinese Mainland and the independence of the Philippines. |
| Parties | |
| Languages | |
| Full text | |
| |||||||||||||||||||||||||||||
531 members of the Electoral College 266 electoral votes needed to win | |||||||||||||||||||||||||||||
|---|---|---|---|---|---|---|---|---|---|---|---|---|---|---|---|---|---|---|---|---|---|---|---|---|---|---|---|---|---|
| Turnout | 61.1%[28] | ||||||||||||||||||||||||||||
| |||||||||||||||||||||||||||||
Presidential election results map. Blue denotes those won by Long/Kennedy, red denotes states won by Dewey/Bricker. Numbers indicate the number of electoral votes allotted to each state. | |||||||||||||||||||||||||||||
| |||||||||||||||||||||||||||||
.jpg)
| New Orleans Race Riot | |
|---|---|
| Part of African-American history, mass racial violence in the United States, terrorism in the United States, and racism against African Americans | |
 Homes and businesses burned in New Orleans | |
| Location | New Orleans, Louisiana, U.S. |
| Coordinates | 36°09′34″N 95°59′11″W / 36.1594°N 95.9864°W |
| Date | June 27 – June 29, 1945 |
| Target | Black residents, their homes, businesses, churches, schools, and municipal buildings over a 60 square block area |
Attack type | White supremacist terrorism, pogrom, arson, mass murder |
| Weapons | Guns, explosives, arson[29] |
| Deaths | Total dead and displaced unknown: 76 total; 61 black and 15 white dead (1945 official records) ~400 black and ~75 white dead (1945 estimate press estimate)[30] |
| Injured | ~1000+ ~225 serious injuries[31] Exact number unknown |
| Perpetrators | White mob[32][33][34][35][36][37] |
| |||||||||||||||||||||||||||||
538 members of the Electoral College 270 electoral votes needed to win | |||||||||||||||||||||||||||||
|---|---|---|---|---|---|---|---|---|---|---|---|---|---|---|---|---|---|---|---|---|---|---|---|---|---|---|---|---|---|
| Turnout | 60.2%[38] | ||||||||||||||||||||||||||||
| |||||||||||||||||||||||||||||
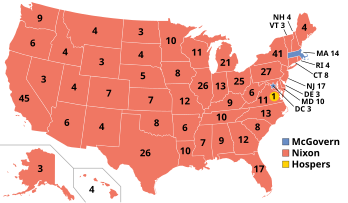 Presidential election results map. Red denotes states won by Nixon/Agnew and Blue denotes those won by McGovern/Shriver. Gold is the electoral vote for Hospers/Nathan by a Virginia faithless elector. Numbers indicate electoral votes cast by each state and the District of Columbia. | |||||||||||||||||||||||||||||
| |||||||||||||||||||||||||||||
.jpg)

| |||||||||||||||||
| |||||||||||||||||
| |||||||||||||||||


| |||||||||||||||||||||||||||||||||||||||||||||||||||
All 650 seats in the House of Commons 326 seats needed for a majority | |||||||||||||||||||||||||||||||||||||||||||||||||||
|---|---|---|---|---|---|---|---|---|---|---|---|---|---|---|---|---|---|---|---|---|---|---|---|---|---|---|---|---|---|---|---|---|---|---|---|---|---|---|---|---|---|---|---|---|---|---|---|---|---|---|---|
| Opinion polls | |||||||||||||||||||||||||||||||||||||||||||||||||||
| Turnout | 72.7%, | ||||||||||||||||||||||||||||||||||||||||||||||||||
| |||||||||||||||||||||||||||||||||||||||||||||||||||
 Colours denote the winning party—as shown in § Results | |||||||||||||||||||||||||||||||||||||||||||||||||||

.jpg)
.jpg)
| |||||||||||||||||||||||||||||||||||||||||
| |||||||||||||||||||||||||||||||||||||||||
| |||||||||||||||||||||||||||||||||||||||||
_Neal_Kinnoch_,_k,_Bestanddeelnr_932-9811.jpg)

| ||||||||||||||||||||||
Should Ireland be an independent country? | ||||||||||||||||||||||
| Results | ||||||||||||||||||||||
|---|---|---|---|---|---|---|---|---|---|---|---|---|---|---|---|---|---|---|---|---|---|---|
| ||||||||||||||||||||||
 Results by council area | ||||||||||||||||||||||
| Note: saturation of colour denotes strength of vote | ||||||||||||||||||||||
| ||||||||||||||||||||||||||||||||
531 members of the Electoral College 266 electoral votes needed to win | ||||||||||||||||||||||||||||||||
|---|---|---|---|---|---|---|---|---|---|---|---|---|---|---|---|---|---|---|---|---|---|---|---|---|---|---|---|---|---|---|---|---|
| Turnout | 62.5%[39] | |||||||||||||||||||||||||||||||
| ||||||||||||||||||||||||||||||||
 Presidential election results map. Blue denotes those won by Roosevelt/Wallace, red denotes states won by Willkie/McNary. Numbers indicate the number of electoral votes allotted to each state. | ||||||||||||||||||||||||||||||||
| ||||||||||||||||||||||||||||||||


| |||||||||||||||||||||||||||||||||||||||||||||||||||||||||||||||||||||||||||||||||||||||||
All 136 seats in the Romanian Diet 69 seats needed for a majority | |||||||||||||||||||||||||||||||||||||||||||||||||||||||||||||||||||||||||||||||||||||||||
|---|---|---|---|---|---|---|---|---|---|---|---|---|---|---|---|---|---|---|---|---|---|---|---|---|---|---|---|---|---|---|---|---|---|---|---|---|---|---|---|---|---|---|---|---|---|---|---|---|---|---|---|---|---|---|---|---|---|---|---|---|---|---|---|---|---|---|---|---|---|---|---|---|---|---|---|---|---|---|---|---|---|---|---|---|---|---|---|---|---|
| Opinion polls | |||||||||||||||||||||||||||||||||||||||||||||||||||||||||||||||||||||||||||||||||||||||||
| Turnout | 26.6% | ||||||||||||||||||||||||||||||||||||||||||||||||||||||||||||||||||||||||||||||||||||||||
| |||||||||||||||||||||||||||||||||||||||||||||||||||||||||||||||||||||||||||||||||||||||||
Colours denote the winning party—as shown in § Results | |||||||||||||||||||||||||||||||||||||||||||||||||||||||||||||||||||||||||||||||||||||||||


| ||||||||||||||||||||||||||||||||||||||||||||||||||||||||||||||||||||||||||||||||||
All 136 seats in the Romanian Diet 69 seats needed for a majority | ||||||||||||||||||||||||||||||||||||||||||||||||||||||||||||||||||||||||||||||||||
|---|---|---|---|---|---|---|---|---|---|---|---|---|---|---|---|---|---|---|---|---|---|---|---|---|---|---|---|---|---|---|---|---|---|---|---|---|---|---|---|---|---|---|---|---|---|---|---|---|---|---|---|---|---|---|---|---|---|---|---|---|---|---|---|---|---|---|---|---|---|---|---|---|---|---|---|---|---|---|---|---|---|---|
| Opinion polls | ||||||||||||||||||||||||||||||||||||||||||||||||||||||||||||||||||||||||||||||||||
| Turnout | 27.2% | |||||||||||||||||||||||||||||||||||||||||||||||||||||||||||||||||||||||||||||||||
| ||||||||||||||||||||||||||||||||||||||||||||||||||||||||||||||||||||||||||||||||||
Colours denote the winning party—as shown in § Results | ||||||||||||||||||||||||||||||||||||||||||||||||||||||||||||||||||||||||||||||||||
| |||||||||||||||||||||||||||||||||||||||||||||
All 150 seats in the Romanian Diet 76 seats needed for a majority | |||||||||||||||||||||||||||||||||||||||||||||
|---|---|---|---|---|---|---|---|---|---|---|---|---|---|---|---|---|---|---|---|---|---|---|---|---|---|---|---|---|---|---|---|---|---|---|---|---|---|---|---|---|---|---|---|---|---|
| Opinion polls | |||||||||||||||||||||||||||||||||||||||||||||
| Turnout | 27.9% | ||||||||||||||||||||||||||||||||||||||||||||
| |||||||||||||||||||||||||||||||||||||||||||||
Colours denote the winning party—as shown in § Results | |||||||||||||||||||||||||||||||||||||||||||||

| ||||||||||||||||||||||||||||||||||||||||||||||||||||||||||||||||||||||||||||||||||
All 200 seats in the Romanian Diet 101 seats needed for a majority | ||||||||||||||||||||||||||||||||||||||||||||||||||||||||||||||||||||||||||||||||||
|---|---|---|---|---|---|---|---|---|---|---|---|---|---|---|---|---|---|---|---|---|---|---|---|---|---|---|---|---|---|---|---|---|---|---|---|---|---|---|---|---|---|---|---|---|---|---|---|---|---|---|---|---|---|---|---|---|---|---|---|---|---|---|---|---|---|---|---|---|---|---|---|---|---|---|---|---|---|---|---|---|---|---|
| Opinion polls | ||||||||||||||||||||||||||||||||||||||||||||||||||||||||||||||||||||||||||||||||||
| Turnout | 26.2% | |||||||||||||||||||||||||||||||||||||||||||||||||||||||||||||||||||||||||||||||||
| ||||||||||||||||||||||||||||||||||||||||||||||||||||||||||||||||||||||||||||||||||
Colours denote the winning party—as shown in § Results | ||||||||||||||||||||||||||||||||||||||||||||||||||||||||||||||||||||||||||||||||||


| ||||||||||||||||||||||||||||||||||||||||||||||||||||||||||||||||||||||||||||||||||
All 200 seats in the Romanian Diet 101 seats needed for a majority | ||||||||||||||||||||||||||||||||||||||||||||||||||||||||||||||||||||||||||||||||||
|---|---|---|---|---|---|---|---|---|---|---|---|---|---|---|---|---|---|---|---|---|---|---|---|---|---|---|---|---|---|---|---|---|---|---|---|---|---|---|---|---|---|---|---|---|---|---|---|---|---|---|---|---|---|---|---|---|---|---|---|---|---|---|---|---|---|---|---|---|---|---|---|---|---|---|---|---|---|---|---|---|---|---|
| Opinion polls | ||||||||||||||||||||||||||||||||||||||||||||||||||||||||||||||||||||||||||||||||||
| Turnout | 26.6% | |||||||||||||||||||||||||||||||||||||||||||||||||||||||||||||||||||||||||||||||||
| ||||||||||||||||||||||||||||||||||||||||||||||||||||||||||||||||||||||||||||||||||
Colours denote the winning party—as shown in § Results | ||||||||||||||||||||||||||||||||||||||||||||||||||||||||||||||||||||||||||||||||||


| ||||||||||||||||||||||||||||||||||||||||||||||||||||||||||||||||||||||||||||||||||
All 200 seats in the Romanian Diet 101 seats needed for a majority | ||||||||||||||||||||||||||||||||||||||||||||||||||||||||||||||||||||||||||||||||||
|---|---|---|---|---|---|---|---|---|---|---|---|---|---|---|---|---|---|---|---|---|---|---|---|---|---|---|---|---|---|---|---|---|---|---|---|---|---|---|---|---|---|---|---|---|---|---|---|---|---|---|---|---|---|---|---|---|---|---|---|---|---|---|---|---|---|---|---|---|---|---|---|---|---|---|---|---|---|---|---|---|---|---|
| Opinion polls | ||||||||||||||||||||||||||||||||||||||||||||||||||||||||||||||||||||||||||||||||||
| Turnout | 27% | |||||||||||||||||||||||||||||||||||||||||||||||||||||||||||||||||||||||||||||||||
| ||||||||||||||||||||||||||||||||||||||||||||||||||||||||||||||||||||||||||||||||||
Colours denote the winning party—as shown in § Results | ||||||||||||||||||||||||||||||||||||||||||||||||||||||||||||||||||||||||||||||||||

| ||||||||||||||||||||||||||||||||||||||||||||||||||||||||||||||||||||||||||||||||||
All 200 seats in the Romanian Diet 101 seats needed for a majority | ||||||||||||||||||||||||||||||||||||||||||||||||||||||||||||||||||||||||||||||||||
|---|---|---|---|---|---|---|---|---|---|---|---|---|---|---|---|---|---|---|---|---|---|---|---|---|---|---|---|---|---|---|---|---|---|---|---|---|---|---|---|---|---|---|---|---|---|---|---|---|---|---|---|---|---|---|---|---|---|---|---|---|---|---|---|---|---|---|---|---|---|---|---|---|---|---|---|---|---|---|---|---|---|---|
| Opinion polls | ||||||||||||||||||||||||||||||||||||||||||||||||||||||||||||||||||||||||||||||||||
| Turnout | 27.5% | |||||||||||||||||||||||||||||||||||||||||||||||||||||||||||||||||||||||||||||||||
| ||||||||||||||||||||||||||||||||||||||||||||||||||||||||||||||||||||||||||||||||||
Colours denote the winning party—as shown in § Results | ||||||||||||||||||||||||||||||||||||||||||||||||||||||||||||||||||||||||||||||||||


| ||||||||||||||||||||||||||||||||||||||||||||||||||||||||||||||||||||||||||||||||||
All 200 seats in the Romanian Diet 101 seats needed for a majority | ||||||||||||||||||||||||||||||||||||||||||||||||||||||||||||||||||||||||||||||||||
|---|---|---|---|---|---|---|---|---|---|---|---|---|---|---|---|---|---|---|---|---|---|---|---|---|---|---|---|---|---|---|---|---|---|---|---|---|---|---|---|---|---|---|---|---|---|---|---|---|---|---|---|---|---|---|---|---|---|---|---|---|---|---|---|---|---|---|---|---|---|---|---|---|---|---|---|---|---|---|---|---|---|---|
| Opinion polls | ||||||||||||||||||||||||||||||||||||||||||||||||||||||||||||||||||||||||||||||||||
| Turnout | 29.8% | |||||||||||||||||||||||||||||||||||||||||||||||||||||||||||||||||||||||||||||||||
| ||||||||||||||||||||||||||||||||||||||||||||||||||||||||||||||||||||||||||||||||||
Colours denote the winning party—as shown in § Results | ||||||||||||||||||||||||||||||||||||||||||||||||||||||||||||||||||||||||||||||||||


| |||||||||||||
| Turnout | 63.1% ( | ||||||||||||
|---|---|---|---|---|---|---|---|---|---|---|---|---|---|
| |||||||||||||
| |||||||||||||


| |||||||||||||
| Turnout | 57.1% ( | ||||||||||||
|---|---|---|---|---|---|---|---|---|---|---|---|---|---|
| |||||||||||||
| |||||||||||||
- ^ "National General Election VEP Turnout Rates, 1789-Present". United States Election Project. CQ Press.
- ^ "National General Election VEP Turnout Rates, 1789-Present". United States Election Project. CQ Press.
- ^ "National General Election VEP Turnout Rates, 1789-Present". United States Election Project. CQ Press.
- ^ "National General Election VEP Turnout Rates, 1789-Present". United States Election Project. CQ Press.
- ^ "National General Election VEP Turnout Rates, 1789-Present". United States Election Project. CQ Press.
- ^ "National General Election VEP Turnout Rates, 1789-Present". United States Election Project. CQ Press.
- ^ "National General Election VEP Turnout Rates, 1789-Present". United States Election Project. CQ Press.
- ^ "National General Election VEP Turnout Rates, 1789-Present". United States Election Project. CQ Press.
- ^ "National General Election VEP Turnout Rates, 1789-Present". United States Election Project. CQ Press.
- ^ "National General Election VEP Turnout Rates, 1789-Present". United States Election Project. CQ Press.
- ^ "National General Election VEP Turnout Rates, 1789-Present". United States Election Project. CQ Press.
- ^ "National General Election VEP Turnout Rates, 1789-Present". United States Election Project. CQ Press.
- ^ "National General Election VEP Turnout Rates, 1789-Present". United States Election Project. CQ Press.
- ^ "National General Election VEP Turnout Rates, 1789-Present". United States Election Project. CQ Press.
- ^ "National General Election VEP Turnout Rates, 1789-Present". United States Election Project. CQ Press.
- ^ "James Brady's death ruled a homicide, police say". CNN.com. 2014-08-09. Retrieved 2015-04-02.
- ^ Cite error: The named reference
BradyHomicidewas invoked but never defined (see the help page). - ^ "James Brady's Death Was a Homicide, Medical Examiner Rules". NBCWashington.com. Retrieved 2015-04-02.
- ^ Pear, Robert (August 25, 1981). "JURY INDICTS HINCKLEY ON 13 COUNTS BASED ON SHOOTING OF PRESIDENT". The New York Times.
- ^ "Voter Turnout in Presidential Elections". The American Presidency Project. UC Santa Barbara.
- ^ "National General Election VEP Turnout Rates, 1789-Present". United States Election Project. CQ Press.
- ^ Cite error: The named reference
isbn=9780198784623was invoked but never defined (see the help page). - ^ "September 21, 1939: FDR urges repeal of Neutrality Act embargo provisions". History.com. Retrieved February 4, 2011.
- ^ Kaltenborn, H. V. (1939-09-22). CBS H. V. Kaltenborn Commentary (Radio).
- ^ Kennedy, David M. (2001). Freedom from Fear: The American People in Depression and War, 1929–1945. Oxford University Press. p. 433. ISBN 978-0195144031.
- ^ Public Resolution 54, 76th Congress, 54 Stat. 4 of November 4, 1939
- ^ Joint Resolution To Repeal Sections 2, 3, and 6 of the Neutrality Act Of 1939, and for Other Purposes, 17 November 1941
- ^ "National General Election VEP Turnout Rates, 1789-Present". United States Election Project. CQ Press.
- ^ Oklahoma Commission 2001, p. 196.
- ^ National Endowment for the Humanities (June 18, 1921). "The broad ax. [volume] (Salt Lake City, Utah) 1895–19??, June 18, 1921, Image 1". The Broad Ax. ISSN 2163-7202. Archived from the original on October 23, 2019. Retrieved October 23, 2019.
- ^ Willows 1921, p. [page needed].
- ^ Cite error: The named reference
Cleaverwas invoked but never defined (see the help page). - ^ Cite error: The named reference
Gurleywas invoked but never defined (see the help page). - ^ Cite error: The named reference
Lutherwas invoked but never defined (see the help page). - ^ Rooney, Lt. Col. L. J. F.; Daley, Charles (June 3, 1921). "Letter from Lieutenant Colonel L. J. F. Rooney and Charles Daley of the Inspector General's Department to the Adjutant General, June 3, 1921". Archived from the original on December 3, 2018. Retrieved December 3, 2018.
- ^ Franklin 1931, pp. 8, 10.
- ^ Oklahoma Commission 2001, pp. 193, 196.
- ^ "National General Election VEP Turnout Rates, 1789-Present". United States Election Project. CQ Press. Archived from the original on July 25, 2014. Retrieved February 21, 2023.
- ^ "National General Election VEP Turnout Rates, 1789-Present". United States Election Project. CQ Press.
Cite error: There are <ref group=lower-alpha> tags or {{efn}} templates on this page, but the references will not show without a {{reflist|group=lower-alpha}} template or {{notelist}} template (see the help page).