
User:Lacunae/26

http://www.metoffice.gov.uk/learning/learn-about-the-weather/how-weather-works/highs-and-lows/pressure The following is a list of atmospheric pressure records in Europe and the extra-tropical Atlantic on synoptic scale (it does not include localised events, such as those which may occur in tornados).
Average pressure of 1013 hPa[1] extreme high values 55 hPa above this, while extreme lows are around 100 hPa lower than average.
Polar_front How powerful a low pressure is, depends mainly on how much the temperature difference between the cold and the hot air is. During the autumn, the days begin to shorter and we receive even less heat from the sun. The polar regions get much less solar radiation than the areas around the equator because the solar angle is less than the poles at this time compared with the summer.North of the polar circle is dark. This gives a greater temperature difference and thus potential for more powerful low pressure.https://www.yr.no/artikkel/derfor-er-det-hoysesong-for-ekstremvaer-1.13861700
It is something of a paradox that extremely high values of atmospheric pressure occur, almost invariably, in winter. High pressure values are associated with anticyclones, and at the risk of over-simplification, one could say that these tend to form where the atmosphere, throughout its depth, is relatively cold. When this is so, the column of air above a particular spot will weigh more than a corresponding column elsewhere, and the extra weight causes the pressure at the surface to be higher than the average. For these reasons, summer anticyclones tend to form over relatively cool ocean areas; high pressure in wintertime, on the other hand, is more likely to be found over the cold continents[1]
Record pressure variations see northwest Europe recording the lowest figures for the continent, while northeast Europe recorded the record high. Variation is less to the south and southwest of the continent.
Eurasian winter Blocking
Lamb (1972) reported that the zone of maximum pressure variability closely mirrors the main subpolar cyclone zone, with the highest mean dp(abs)24 values of 11 hPa in winter just off the Atlantic seaboard of Nova Scotia–Newfoundland and near East Greenland–Iceland, reflecting sharp temperature contrasts and pressure changes in these regions; in summer, in accordance with generally much less stormy conditions, the zone of highest mean dp(abs)24 was 6 hPa in the south of Hudson Bay.[2]
The winter months of January is when the highest pressures and lowest pressures are seen, with the summer seeing a lower chance of extreme values.
almost all of these values relate to the winter months. This is because the winter pressure records combine the two types of anticyclone, the thermal and the dynamic. To put it simply, the dynamic anticyclone is due to the subsidence of the air mass from the upper atmosphere; its standard model is the Azores anticyclone. The thermal anticyclone is linked to the weight of very cold and very dense air close to the ground; it does not usually find its trace at high altitude. This type of anticyclone is generally encountered winter on continental shields such as Russia or Canada, and ground pressures regularly exceed 1050 hPa. In winter, both effects usually combine, even if the air close to the ground is not extremely cold. In summer, however, convective ancestries tend to thwart dynamic subsidence and lower the pressure.[3]
It is easy to assume that any truly intense midwinter anticyclone must be an offshoot of an intense ‘Siberian High’ ridging westwards; however, as these accounts show, the majority are more normally ‘Atlantic’ in origin...."in this summary, only the systems in January 1882, January 1907,January 1932 and January 1992 were of thistype. The remaining events developed over the Atlantic as travelling anticyclonesbetween intense depressions (January 1896,January 1957, February 1964) or more locally in the wake of a depression plungingsouth-eastwards across the North Sea (January 1902, December 1926). The systemin January 1905 was a hybrid, in thatalthough it presented as a ‘Continental’ anticyclone,the original high pressure system was of Atlantic origin.[4]
The highest air pressure is achieved in the winter of areas far from the sea. Here cooler ground of without Sun's warming rays, whereby the air takes up less space. Further up in the atmosphere, the space filled by the inflowing air, whereby the total weight of the air above the area becomes higher.-http://illvid.dk/fysik/hvad-er-rekorderne-for-lufttryk
relationship between intense lows and highs... national records for Norway and Denmark in same winter, 2016 October high preceded by 2nd lowest September low in Sweden etc...[5] the development of a series of intense depressions can lead to the rapid intensification of travelling anticyclones, and where both are embedded in a mobile flow rapid changes in atmospheric pressure can result as the systems pass over a point on the surface. Accounts of notable ranges in barometric pressure are harder to come by, but the following serve as examples: ● In January 1902, Aberdeen Observatory recorded a rise of almost 70 mbar in 88 hours, from 984.8 mbar at 0500 and 0600 GMT on 28 January to the British Isles highest of 1053.6 mbar at 2200 GMT on 31 January; ● In February 1938 Deerness, Orkney recorded 948.0 mbar on 1st followed by 1037.1 mbar on 19th, a range of 89.1 mbar within three weeks; ● In May 1943, Dublin recorded 971.0 mbar on 8 May followed by 1042.2 mbar on 16th, a rise of 71 mbar in eight days; ● In early 1962, Lerwick (Shetland) recorded 954.7 mbar on 11 January followed less than six weeks later by 1049.1 mbar on 23 February, a range of 94.4 mbar; ● In late January 1989, the barometric pressure reached 1045 mbar widely across southern England: on 25 February the pressure fell below 949 mbar at Portland, Dorset (see Part 1 for details), a range of 96 mbar in less than four weeks; ● In November–December 2005, the barometric pressure in parts of southwest England fell from 1038 mbar on 22 November to 964 mbar on 2 December before recovering to 1041 mbar on 11 December – a fall of 74 mbar in 10 days followed by a rise of 77 mbar in 9 days[6]
Fox 1905. long noted high pressure follows 3 week period...etc
Lows Intense synoptic events are usually foreshadowed by large abnormalities in the general circulation for periods of a month or more beforehand. In other words, it would seem that these large scale anomalous circulation patterns have predisposed the atmosphere to favour singular events. This alteration can usually be seen in the midtropospheric flow patterns, their sea-level counterparts,and the associated anomalous sea surface temperature (SST)patterns. The mean flow patterns are statistical ensembles that indicate sizeable departures from normal in the prevailing character and intensity of anomalies of temperature, static stability, moisture, and other properties.[7] Sanders and Gyakum in their formula for bomb cyclones note latitude is impt factor in deepening, noting that an equivalent intensification is dependent on latitude: at the poles this would be a drop in pressure of 28 mb/24 hours, while at 25 degrees latitude it would be only 12 mb/24 hours. All these rates qualify for what Sanders and Gyakum called "1 bergeron".[8]
Cold winter anticyclones are those typically generate the greatest high surface pressures. The cold, heavy air stagnates at low levels. The absence of winds at these levels favors no exchange of air masses and displacement of the anticyclone. The powerful dorsal/back/ridge still maintaining the high pressure system in lower layers can be secured at different levels and extended to higher levels, say 500 to 300 hPa. All this generates widespread subsidence manifested in the form of sinking air at different levels. Subsidence eliminates any trace of clouds that prevent heat retention in lower layers, which together with the long, clear nights, generate a cooling of the Earth's surface had increased its clouds.[9] There's a reason our old record was also set in December as it usually takes a cold, arctic air mass to make for our higher pressure readings -- the summer time heat ridges never get this close because warm air is less dense.[10]
Over an average winter season the North Atlantic sees only one or two cases of storms developing below 950mb pressure.[11] it is rare for pressure to rise above 1050 mb or fall below 950 mb.-http://www.metoffice.gov.uk/media/pdf/a/t/No._11_-_Weather_Charts.pdf
somewhat in the same fashion that low pressure systems sometime ‘bomb out’ along the Eastern Seaboard of the United States (and Northern Atlantic) after entraining, in their case, Gulf Stream moisture and Canadian cold, dry air.[12]
North Atlantic oscillation [13]
We observed that the Atlantic produced deeper HF cyclones (pressure wise) than the Pacific. We surmise that this is due to the higher baroclinicity (stronger temperature gradients) of the Atlantic compared to the Pacific. We also found that the Atlantic can produce weaker (pressure wise) HF storms than the Pacific. These are assumed to be due to the orographic influences of Greenland.-http://www.vos.noaa.gov/MWL/april_05/cyclones.shtml
there is a distinct seasonal cycle in atmospheric pressure in Iceland, with winter minima: the month with the lowest mean pressure was January at 998.7 hPa; the highest was May at 1013.2 hPa. There are coherent semi-decadaloscillations in pressure, as indicated by running means (Figure 3). Similarly, the variance changes with timeon a semi-decadal basis (Figure 3). Spectral analysis shows no single dominant peak, but the 12 year peak is suggestive of solar activity, which is known to have an 11 year period, and is suggested in an 11.6 year period found in the GRIP ice core in Greenland (Johnsenet al., 1997) (Figure 4). [14] lagged solar response Europe and Nth Atl.[15][16]
http://www.ijmet.org/wp-content/uploads/2014/09/213.pdf Role of the Stratosphere in Explosive Deepening of Extratropical Cyclones
North Atlantic Oscillation scientists say in 150 years, 3/5 all time atmospheric pressure highs & 2/5 record lows occurred in last 10 years https://twitter.com/FranMcElhone/status/509960894433198081
This is also the reason why summer highs can never be so strong, because warm air is less dense than cold.https://www.wetteronline.de/wetternews/2017-02-08-he
low left high right.https://www.dwd.de/DE/wetter/thema_des_tages/2019/7/7.html
strong contrast, strong jet stream https://www.scientias.nl/luchtdruk-in-nederland-momenteel-bijzonder-hoog/
Global record barometric pressure records[edit]
- Highest
The World Meteorological Organisation [17][18] Globally... Siberian high The world record The highest accepted adjusted-to-sea-level barometric pressure ever recorded (below 750 meters) was at Agata, Evenhiyskiy, Russia (66°53’N, 93°28’E, elevation: 261 m (856.3 ft)) on 31 December 1968 of 1,083.3 hectopascals (hPa) (31.99 inHg).[19]
Highest air pressure ever recorded (above 750 meters): 1084.8 hPa (32.03 inHg); Tosontsengel, Khövsgöl Province, Mongolia, 19 December 2001.[20] This is the equivalent sea-level pressure; Tosontsengel is located at 1,300 metres (4,300 ft) above sea level. The discrimination is due to the problematic assumptions (assuming a standard lapse rate) associated with reduction of sea level from high elevations.[20][19]
The normal high barometric pressure at the Dead Sea, as measured by a standard mercury manometer and blood gas analyzer, was found to be 799 mmHg (1065 hPa).[21]
- Lowest
- Land-based measurement 1935_Labor_Day_hurricane 892 hPa also. Dr. Jeff Masters of Weather Underground estimated that Typhoon Haiyan 2013 may have had a central pressure of 888 mb (hPa; 26.23 inHg) when it struck Leyte.[22]
- The lowest non-tornadic atmospheric pressure ever measured was 870 hPa (25.69 inHg), set on 12 October 1979, during Typhoon Tip in the western Pacific Ocean. The measurement was based on an instrumental observation made from a reconnaissance aircraft.[23]
Atlantic 882 millibars Hurricane Wilma.https://www.washingtonpost.com/blogs/capital-weather-gang/wp/2015/10/19/ten-years-ago-hurricane-wilma-underwent-most-extreme-intensification-in-atlantic-history/
Typhoon_Maysak_(2015) estimated pressure of 905 mb from the JMA-http://www.met.reading.ac.uk/~brugge/world2015.html
ex Cyclone Nuri November_2014_Bering_Sea_cyclone 924 hpa since 1977.http://7city.org/main/142-cyclone-in-the-bering-sea-in-1977-broke-the-record.html
The lowest pressure: 850 mbar; recorded during a tornado at Manchester, South Dakota, United States, 2003-06-24[24]
Land-based observations in Europe[edit]
Iceland[edit]
Faroe Islands[edit]
21 February 1944 Faroe Islands 1053.0. Neue Methoden der Wetteranalyse und Wetterprognose Richard Scherhag Springer-Verlag, 9 Mar 2013 https://books.google.co.uk/books?id=8WSXBwAAQBAJ&lpg=PA125&ots=bTCFSSh-Lf&dq=luftdruck%20hoch%201882%20januar&pg=PA126#v=onepage&q=luftdruck%20hoch%201882%20januar&f=false
https://www.metoffice.gov.uk/hadobs/emslp/anselletal2006.pdf anseell et al 2006 10.1175/JCLI3775.1
wizzle.[note 1]
Ireland[edit]
Isle of Man[edit]
United Kingdom and Ireland[edit]

For the United Kingdom, the Met Office record the record figures for barometric pressure (which are nominally since 1870) as: https://twitter.com/wanstead_meteo/status/1127520499393810432
- Highest air pressure: 31 January 1902, Aberdeen Scotland 1053.6 hPa.
- Lowest air pressure: 26 January 1884, Ochtertyre Scotland 925.6 hPa.
Though may be second to the Night of the big wind low which saw a value of 27.25 inches of mercury (923 hPa) at Sumburgh Head, Shetland on non-calibrated, non-standard equipment 6-7 January 1839, with the mainland at Cape Wrath reporting an observed pressure of 27.32 inches of mercury (925 hPa).[26]
United Kingdom monthly maximum figures for barometric pressure[edit]
| Month | Date | Location | pressure hPa | Alternative and UK only records |
|---|---|---|---|---|
| January | 31 January 1902 | Aberdeen Observatory, Aberdeenshire | 1053.6† | |
| February | 1 February 1902 | Aberdeen Observatory, Aberdeenshire | 1052.9 | |
| March | 9 March 1953 | St Mary's Airport, Isles of Scilly | 1047.9 | An alternative value is reported 9 March 1953, Tynemouth 1048.6 hPa[28] |
| April | 11 April 1938 | Eskdalemuir, Dumfriesshire | 1044.5 | |
| May | 16 May 1943 | Dublin Airport, Ireland | 1042.2 | UK value: 1881, Aberdeen, Glasgow and Armagh 1042 hPa.[28] 13 May 2019 1041.7 https://twitter.com/danholley_/status/1128220814589952000 |
| June | 14 June 1959 | Clones Co. Monaghan | 1043.1 | UK value: 14 June 1959, "Northern Ireland" 1043 hPa (Irish record is within 1km of UK border).[28] 15 June 1874 Scotland >1040 hPa.[29] |
| July | 16 July 1996 | Aboyne, Aberdeenshire | 1039.2 | |
| August | 25 August 1968 | Kirkwall, Orkney | 1037.4 | |
| September | 11 September 2009 | Ballykelly, Co. Londonderry | 1042.0 | |
| October | 31 October 1956 | Dyce, Aberdeenshire | 1045.6 | |
| November | 10 November 1999 | Aviemore, Invernessshire | 1046.7 | |
| December | 24 December 1926 | Wick, Caithness | 1051.9 |
(† note the value of 1054.7 reported in some literature is an incorrect conversion.[30])
19 September 1986, Shawbury Shropshire 1041.2 hPa.[28] UK value 1038.9 12 May 2012? Heathrow Airport.[31] 15 June 1874, Scotland >1040[29]
United Kingdom list of barometric pressure over 1050 hPa[edit]
| Date | Location | pressure hPa |
|---|---|---|
| 24 February 1808 | Gordon Castle, Moray Scotland | 1050.0 |
| 8—9 January 1820 | Kinfauns Castle, Perth Scotland | 1051.7 |
| 9 January 1896 | Ochtertyre, Perth Scotland | 1053.4 |
| 31 January 1902 | Aberdeen, Scotland (UK record) | 1053.6 |
| 28 January 1905 | Falmouth, Cornwall | 1053.1 |
| 23 January 1907 | Aberdeen, Scotland | 1051.8 |
| 24 December 1926 | Wick, Scotland | 1051.9 |
| 26 January 1932 | Stonyhurst, Sheffield and Meltham, West Yorshire | 1051.0 |
| 16 January 1957 | Belmullet, Co Mayo Ireland | 1050.9 |
In the period of instrumental measurement the barometric pressure has exceeded 1048 hPa somewhere over the United Kingdom and Ireland on 17 occasions.[4] On 9 of these times the pressure has exceeded 1050 hPa- a value which has not been exceeded since 1957 in Ireland, but has not been surpassed since 26 January 1932 over the UK.[4] Intense high pressure is usually seen during midwinter with 7 of the 9 occasions where 1050 hPa has been exceeded occurring in January.[4]
Pressure values have been recorded to have exceeded 1050 hPa in all areas of the UK and Ireland except south east England, though values close to this are documented from January 1882 and January 1905.[4]
United Kingdom monthly minimum figures for barometric pressure[edit]
| Month | Date | Location | pressure hPa | Alternative and UK only records |
|---|---|---|---|---|
| January | 26 January 1884 | Ochtertyre, Perthshire | 925.6 | Alternative: 6-7 January 1839, Sumburgh Head, Shetland during the Night of the big wind storm 27.25 inches of mercury (922.8 hPa), (value from non-standardised equipment).[26] |
| February | 4 February 1951 | Midleton, Co. Cork | 942.3 | UK value: 9 February 1988, Benbecula 944.0 hPa.[28] |
| March | 9 March 1876 | Wick, Caithness | 946.2 | |
| April | 1 April 1948 | Malin Head, Co. Donegal | 952.9 | UK value: 1 April 1948, The Hebrides 953 hPa.[28] |
| May | 8 May 1943 | Sealand, Flintshire (listed as Cheshire) | 968.0 | |
| June | 28 June 1938 | Lerwick, Shetland | 968.4 | |
| July | 8 July 1964 | Sule Skerry, Northern Isles | 967.9 | |
| August | 14 August 1954 | Belmullet, Co. Mayo | 967.7 | UK value: 26 August 1912, Great Yarmouth 978 hPa.[28] |
| September | 21 September 1953 | Claremorris, Co. Mayo | 957.1 | UK value: 16-17 September 1935, "Central England" 960 hPa.[28] |
| October | 14 October 1981 | Cawdor Castle, Highland (listed as Nairnshire) | 946.8 | **Cyclone Oratia |
| November | 11 November 1877 | Monach Lighthouse, Outer Hebrides | 939.2 | |
| December | 8 December 1866 | Belfast, Antrim | 927.2 | On the morning of 8 December 1886, the barometer may have fallen as low as 924 mbar over northern Ireland, although the lowest authenticated value was 927.2 mbar at Belfast at 1330h, close to the centre of the depression.-http://www.uktrail.com/colchat/viewtopic.php?f=7&t=913 |
Corroborative evidence is afforded by the (MSL) readings of 927.2 mbar at Aberdeen at 2330h, 927.3 mbar at Dundee at 2230h, 927.4 mbar at Culloden, near Inverness, at 2300h, 927.5 mbar at Oban at 2100h, 928.8 mbar at Glasgow and 929.6 mbar in Edinburgh. Contemporary sources agree that these were the lowest pressures recorded in Scotland for at least the previous 120 years.-http://www.uktrail.com/colchat/viewtopic.php?f=7&t=913
- Cyclone Oratia estimated at 941 in peer reviewed, reananlysis of 948.0 in XWS catalogue.-http://www.europeanwindstorms.org/cgi-bin/storms/storms.cgi?storm1=Oratia_Tora though lowest pressure between Aberdeen and Norway at ref ... not a land-based observation, but an estimate of central low. Lowest UK pressure RAF Fylingdales at 951.2 hPa.[32]
7 September 1995, Scilly Isles, 966 hPa.[33] Lowest minimum recorded values for the months May to August within 0.5 of 968 hPa. 17 September 1935
20th Century low pressure record in the UK 20 December 1982: at Sule Skerry it may have dropped as low as 936 mbar on this occasion. I wrote this event up in Weather (Burt SD. 1983. New UK 20th century low pressure extreme. Weather, 38: 208–213, and Burt SD. 1983.-http://www.uktrail.com/colchat/viewtopic.php?f=7&t=913
United Kingdom list of barometric pressure below 950 hPa[edit]
- 1821 December 25, London 27.93 inches of mercury (946 hPa).[34]
- 1839 January 7, Night of the big wind, pressure below 28 inches of mercury (950 hPa) at Inchkeith, Peterhead and Aberdeen.[34]
- 1865 December 31, Butt of Lewis Lighthouse 27.69 inches of mercury (938 hPa), with a report of 27.63 inches of mercury (936 hPa) from Hoy which is not supported by observation from Cantick head lighthouse on South Walls.[34]
- 1884 Ochtertyre
- 2013 Cyclone Dirk
Home nation records[edit]
Based on Burt 2007
Scotland[edit]
Same as UK national records.
- Highest: 31 January 1902, Aberdeen Observatory 1053.6 hPa.
- Lowest: 26 January 1884, Ochtertyre Scotland 925.6 hPa.
Northern Ireland[edit]
- Highest: 2020
- Lowest: 8 December 1886, in Belfast 927.2 hPa.(A reading of 922.5 mbar (corrected to MSL) was reported from Omagh in Co. Tyrone...Harding (1887, p 211) the graduation and calibration of the barometer concerned were not considered satisfactory enough “to quote the reading as trustworthy”, storm minimum over the north of Ireland was thought to be close to 924 mbar.)
Wales[edit]
- Highest: 27 Jan 1992, Sennybridge Powys 1049.2 hPa.
- Lowest: 22 November 1865, Dolgellau, North Wales 944.8 hpa.
Alt 1992, Trawsgoed, Wales 1050.0 hPa.[35]
England[edit]
- Highest: 28 January 1905, Falmouth, Cornwall 1053.1 hPa. 31.097 inches of mercury (1,053.1 hPa)http://www.metoffice.gov.uk/binaries/content/assets/mohippo/pdf/0/3/jan1905.pdf
- Lowest: 8 December 1886, Stonyhurst in Lancashire, where the barometer fell to 940.4 hPa.
-alt North Shields 26th January 1884 27.63" (936mb) https://www.netweather.tv/forum/topic/48934-the-lowest-pressure-reading-recorded-in-the-uk/
25 December 1821, "North London" 945.8 hPa.
Norway[edit]
Yr.no the joint venture between the Norwegian Broadcasting Corporation and the Norwegian Meteorological Institute give the national pressure records as:
- Highest air pressure: 23 January 1907, Dalen, Telemark 1 061.3 hPa.[36]
- Lowest air pressure: 27 January 1907, Bergen 936 hPa.[36]
Both records in same winter as each other and those of Denmark.
- 15 February 1989 937.1 hPa http://www.synoptische-meteorologie.de/extras/wetterrekorde-europa/wetterrekorde-nordeuropa/
- >1050 Norway 8 February 2012-http://www.met.fu-berlin.de/de/wetter/maps/Analyse_20120208.gif
1054.5 hPa Blindern 18 November 1985, 1051.6 hPa Oslo 4 Feb 1991, 1055.6 hPa Hansmoen, Tynset 30 January 2012.[37]
| Month | Date | Location | pressure hPa | ref | notes |
|---|---|---|---|---|---|
| January | 23 January 1907 | Dalen, Telemark | 1061 | [36] | |
| February | 4 February 1991 | Oslo | 1051.6 | [38] | Sihccajavri https://twitter.com/Meteorologene/status/968138893768974338/photo/1?ref_src=twsrc%5Etfw&ref_url=https%3A%2F%2Fwww.yr.no%2F |
| May | 3 May 2017 | Trondheim | 1039.6 | [39] | *Local record, may not be national |
| October | 3 October 2016 | Hedmark | 1050. | [40] | *data from 1957, previously October 1971 Bergen 1042.1 hPa. |
| November | 18 November 1985 | Blindern | 1054.5 | [38] | *highest at Blindern regardless of month 1952-2012, may not be national record, only local. |
1054.3 Otta[41][42] 309 m a s l [43]
The highest pressure measured at Oslo whatever month is 1054.5 hectopascal 18th November 1985.!?!?!??!? The highest pressure measured at rekordhoyt-trykk-i-europa-1.7980968
--Jan--
- 1056.1 hPa 9 Jan 2010 Drevsjø i Engerdal http://www.verogvind.net/readmore.asp?readmoreid=2383
- 1055 11 hPa Jan 1987 Bråtå mslp 705m alt.[44]
--Feb--
Minimum[edit]
| Month | Date | Location | pressure hPa | ref | notes |
|---|---|---|---|---|---|
| January | 27 January 1884 | Bergen area | values range between 935.8–939.8 | [36] | A value of 702.0 mm Hg at Bergen Lungegård Hospital on January 27, 1884 (935.8 hPa) is reported,[45][46] which is likely to be from the same low as the UK record from Ochtertyre the previous day. Other sources give a pressure value of 939.8 hPa or 939.7 hPa in Bergen on 27 January 1884.[47][48][49] |
| February | 20 February 1907 | Skudenes on the island of Karmøy, Rogaland | 938.5 | [36] | 20 February 1907 Oksøy Lighthouse, Kristiansand 941.0 hPa[50] |
10 February 2020, Solvær III, Lurøy Nordland 942.5 hPa.[50] Yr.no values for date Sklinna_Lighthouse 943.1 hPa http://twitter.com/Meteorologene/status/1227191836311203845
north norway https://www.itromso.no/meninger/2020/02/11/Rekordlett-luft-over-Troms%C3%B8-21060866.ece
Hartmut Feb 2018[edit]
26 February 2018, Šihččajávri Finmark 1055.6 hPa.https://twitter.com/Meteorologene/status/968138893768974338/photo/1?ref_src=twsrc%5Etfw&ref_url=https%3A%2F%2Fwww.yr.no%2F 27 February 2018, Harparanda Sweden 1055.8 hPa.https://www.smhi.se/bloggar/vaderleken-2-3336/summering-av-det-maktiga-hogtrycket-1.131682 (record 2012 Harparanda 1058)
Jan Mayen[edit]
Svalbard[edit]
http://svalbardposten.no/index.php?page=vis_nyhet&NyhetID=3340
The highest air pressure was measured at Karl XII island where it was registered 1054.7 hPa. It erases the previous record of 1051.9 hPa on 28 January 1929.http://www.adressa.no/vaeret/article7270389.ece http://www.aftenposten.no/norge/Malte-monster-hoytrykk-i-Arktis-124933b.html
28 January 1929 Spitzbergen 1054.2see Neue methoden below
gridded data 1971-2015 lowest 948 hpa highest -http://www.borenv.net/BER/pdfs/ber23/ber23-283-297.pdf
low of 958 in may -https://trj.blog.is/blog/trj/entry/2250017/
25 Jan 2022 938 hPa was measured last night on Kvitøya on Svalbard, the lowest pressure since the station started in 1986 Chart with downwards trend We have not registered such a low pressure before in this area! https://twitter.com/Meteorologene/status/1485915865635717120
Bjornoya[edit]
Bear_Island_(Norway) 20 March 2013 1050.1 hPa, previous record March 20 1969 1043.6 hPa[51] see Greenland
Denmark[edit]
The Danish Meteorological Institute report record barometric pressure for the Denmark (since 1874) as:
Danish records both occurred within a month during the same winter, and same winter as Norwegian records.[54]
September record was beaten on 29 September 2015 with pressure over 1042.2 hPa recorded in Østerbro Copenhagen, previous September record dated from September 18, 1904, where the pressure came up to 1038.8 hPa at Hammer Odde Lighthouse, Bornholm.[55][56] Den gamle rekord i Thyborøn er fra den 21. september 1998, hvor lufttrykket nåede op på 1038,1 hPa. http://folkebladetlemvig.dk/lemvig/vejret-saetter-rekord-i-thyboroen
The records mentioned above are the conclusion of TV 2 VEJRET based on data from DMI's Technical Report No. 15-02. The records are based on measured air pressure values at the stations mentioned. From 1874 to 1987, the air pressure was measured manually three times a day, whereas from 1987 onwards, it took place automatically first eight times a day and from around the millennium every hour.Before 1987, the air pressure was measured manually in Vestervig and then automatically in Thyborøn and also in Nordby on Fanø and then automatically in Esbjerg. However, the relatively large margins for the old records in comparison with the short distance between the measurement stations make - despite the fewer daily measurements previously - the records considered very likely.http://vejr.tv2.dk/2015-09-29-taarnhoejt-lufttryk-over-danmark-slaar-rekord
Denmark Monthly maximum figures for atmospheric pressure[edit]
| Month | Date | Location | pressure hPa | ref | |
|---|---|---|---|---|---|
| January | 23 January 1907 | Skagen | 1062.5 | ||
| February | 7 February 2012 | Thyborøn | 1050.3 | [58] | 2012 value exceeds 1961-1990 maximum. |
| March | 30 March 1977 | Bornholm Airport | 1047.0 | ||
| April | 16 April 1962 | Skagen | 1040.6 | ||
| May | 3 May 1990 | Christiansø Lighthouse | 1041.6 | ||
| June | 7 June 1962 | Skagen | 1038.8 | ||
| July | 16 July 1972 | Christiansø Lighthouse | 1031.9 | ||
| August | 18 August 1966 | Christiansø Lighthouse | 1032.8 | ||
| September | 29 September 2015 | Østerbro | 1042.2 | [59][60] | *Previously 18 September 1904, Hammer Odde Lighthouse 1038.8 hPa. (or 29 September 1970, Bornholm Airport 1040.0 hPa)[57] |
| October | 5 October 2016 | Skagen | 1045.5 | [61][62] | *Previously 6 October 1877, Hammer Odde Lighthouse 1044.7 hPa. |
| November | 18 November 1985 | Skagen | 1052.4 | ||
| December | 24 December 1962 | Fornæs Lighthouse and Værløse Air Base | 1051.6 |
Denmark monthly minimum figures for atmospheric pressure[edit]
| Month | Date | Location | pressure hPa | ref | |
|---|---|---|---|---|---|
| January | 14 January 1984 | Skagen | 950.2 | ||
| February | 20 February 1907 | Skagen | 943.9 | ||
| March | 25 March 1986 | Skrydstrup Airport | 961.4 | ||
| April | 21 April 1967 | Skagen | 975.7 | ||
| May | 28 May 1972 | Thyborøn | 985.1 | ||
| June | 6 June 1977 | Skagen | 985.1 | ||
| July | 30 July 1965 | Skagen | 982.5 | ||
| August | 6 August 1985 | Thyborøn | 980.1 | ||
| September | 22 September 1990 | Thyborøn | 970.1 | ||
| October | 18 October 1967 | Tirstrup | 966.7 | FYI Hvide Sand reported low 30 Oct 2000 (Oratia) unknown if lowest, unknown time, 976.4.http://www.geodata.us/weather/show.php?usaf=060580&uban=99999&m=10&c=Denmark&y=2000 Thyboron 978.2.http://www.geodata.us/weather/show.php?usaf=060520&uban=99999&m=10&c=Denmark&y=2000 | |
| November | 6 November 1985 | Aalborg Airport | 953.0 | ||
| December | 10 December 1965 | Thyborøn | 955.2 |
5 January 2012 lowest pressure in Denmark in 5 years 962.7 hPa på Anholt, lowest since 18 March 2007 nåede lufttrykket i Skagen ned på 958,6 hPa.[63]
Denmark list of barometric pressure over 1050 hPa[edit]
| Date | Location | pressure hPa | |
|---|---|---|---|
| 7 February 2012 | Thyborøn | 1050.3 | 8 February 2012 north jutland >1050-http://www.met.fu-berlin.de/de/wetter/maps/Analyse_20120208.gif |
| 18 November 1985[65] | Thyborøn | 1050.3 | |
| 1962 | Denmark | 1052 | |
| 23 January 1907 | Skagen | 1062.5 |
Sweden[edit]
The Swedish Meteorological and Hydrological Institute give the nation's barometric records as:
Sweden monthly maximum figures for barometric pressure[edit]
| Month | Date | Location | pressure hPa | ref | |
|---|---|---|---|---|---|
| January | 23 January 1907 | Kalmar and Visby | 1063.7 | [68] | |
| February | 1 February 2012 | Haparanda | 1058.0 | [69] | |
| March | 1 March 1971 | Svartbyn-Överkalix | 1055.7 | [70] | |
| April | 15 April 1860 | Uppsala | 1047.1 | [71] | |
| May | 7 May 1893 | Umeå | 1048.0 | [72] | |
| June | 3 June 1979 | Sveg | 1044.8 | [73] | |
| July | 28 July 1963 | Sveg and Särna | 1035.6 | [74] | |
| August | 25 August 1968 | Riksgränsen | 1038.8 | [75] | |
| September | 16 September 1903 | Sveg | 1042.0 | [76] | *29 September 2015, Hagshult (Småland) 1042.9 hPa.[77] |
| October | 14 October 1896 | Stockholm | 1048.6 | [78] | |
| November | 18 November 1985 | Malung and Rännberg-Östmark, Värmland. | 1056.0 | [79] | |
| December | 15 December 1946 | Sveg | 1059.2 | [80] |
Sweden monthly minimum figures for barometric pressure[edit]
| Month | Date | Location | pressure hPa | ref | |
|---|---|---|---|---|---|
| January | 30 January 2000 | Krångede, Jämtland | 946.2 | [81] | Kerstin, Orkanen Reidun |
| February | 27 February 1990 | Understen, Uppland | 940.5 | [82] | Vivian |
| March | 8 March 1920 | Abisko, Lappland | 948.3 | [83] | |
| April | 6 April 1943 | Gäddede, Jämtland | 960.3 | [84] | |
| May | 12 May 1898 | Karlstad | 971.3 | [85] | |
| June | 29 June 1938 | Storlien | 976.2 | [86] | |
| July | 9 July 1931 | Ulricehamn | 977.1 | [87] | |
| August | 6 August 1941 | Måseskär | 975.7 | [88] | |
| September | 29 September 1956 | Klutmark, Västerbotten | 960.9 | [89] | |
| October | 19 October 1970 | Edsbyn | 954.1 | [90] | |
| November | 1 November 1921 | Holmögadd, . | 948.3 | [91] | |
| December | 6 December 1895 | Härnösand | 938.4 | [92] |
13 March 1996 saw a high of 1050.5 recorded at Vilhelmina airport.[93] March record Svartbyn-Overkalix 1971.[93]
Sweden logged its highest pressure reading in 40 years on Sunday. The reading of 1057.0 hPa at Haparanda was the highest since 1059.9 hPa on 30th January 1972.
Also, Kalliojoki Kuhmo in eastern Finland recorded air pressure of 1062.0 hPa on Sunday
http://www.smhi.se/nyhetsarkiv/hoga-lufttryck-svenskt-februarirekord-1.19784 http://www.ukweatherworld.co.uk/forum/index.php?/topic/89180-pressure-watch-eastern-europe-27th-jan-onwards-10683-hpa-khoseda-khard-%E2%80%A2new-all-time-record%E2%80%A2/page__st__20
Sweden has only twice seen low pressure below 950 hPa both times in December, the all-time record and again following a similar track across mid-Sweden on 16 december 1982 at Sundsvall Airport at 940.1 hPa.[92] Pressure fell to about 939 mbar over the Gulf of Bothnia (between Sweden and Finland) on the morning of 16 December 1982.[95]
Sweden list of barometric pressure over 1060 hPa[edit]
Sweden has only ever recorded air pressure above 1060 hPa during the month of January 1907.[96]
| Date | Location | pressure hPa |
|---|---|---|
| 23 January 1907 | Kalmar | 1063.7 |
| 23 January 1907 | Visby | 1063.7
incomplete |

https://www.smhi.se/bloggar/vaderleken-2-3336/extremt-hogt-septemberlufttryck-vantas-nasta-vecka-1.125171 September record for Norrland 2017 https://twitter.com/forecasverige/status/912575031179403265
- http://blogg.foreca.se/2017/09/hogtryck-pa-hosten-nytt-septemberrekord-i-hogtryck/
- https://www.smhi.se/nyhetsarkiv/nytt-svenskt-lufttrycksrekord-for-september-1.125412
- FUB Rosi
Finland[edit]
According to the Finnish Meteorological Institute:
Though reported low value by Weather Underground weather historian Christopher Burt on 1 March 1990 at unknown location at low of 939.7 hPa.[98] -reanalysis http://www.wetterzentrale.de/pics/archive/ra/1990/Rrea00119900301.gif note Sweden February record is on 27 feb 1990 (Associated with the more northerly tracking of the two low centres of Vivian (storm).
Cooper/Dieter 29 January 2012, Suomussalmi Pesio in Finland at 1061.3 hPa -http://www.ukweatherworld.co.uk/forum/index.php?/topic/89180-pressure-watch-eastern-europe-27th-jan-onwards-10683-hpa-khoseda-khard-%E2%80%A2new-all-time-record%E2%80%A2/
1067.1 22 January 1907 Helsinki.https://books.google.co.uk/books?id=8WSXBwAAQBAJ&pg=PA125&lpg=PA125&dq=luftdruck+hoch+1882+januar&source=bl&ots=bTCFSSh-Lf&sig=c_iYq7vbXbJeHq7shW1h0t4akCk&hl=en&sa=X&ved=0ahUKEwjZkMSV_LHOAhWFIsAKHZ20DMAQ6AEILzAC#v=onepage&q=luftdruck%20hoch%201882%20januar&f=false Neue Methoden der Wetteranalyse und Wetterprognose
Front Cover Richard Scherhag Springer-Verlag, 9 Mar 2013
| Month | Date | Location | pressure hPa | ref |
|---|---|---|---|---|
| January | 22 January 1907 | Heksinki | 1066 | 2nd 30/01/1972 Kuusamo. Finland air pressure record, 1066 hPa.-http://saaseuranta.munblogi.com/2015/03/07/ Kuusamo lentoasema 1063.7.https://en.ilmatieteenlaitos.fi/download-observations |
| February | 1 February 2012 | Kuhmo Kalliojoki | 1062.8 | [99] 1 Feb 2012 0610 UTC Kuhmo Kalliojoki 1062.9 hPa.[100] |
| March | 15-17 March 2015 | Finland | 1049 | "Luisa" (FUB) (1054 Lake Ladoga) -http://www.met.fu-berlin.de/wetterpate/Lebensgeschichten/Hoch_LUISA_09_03_15.htm |
| December | 7 December 2002 | Kallan lighthouse, Pietarsaari | 1060 | http://webcache.googleusercontent.com/search?q=cache:ZKeBToAsAfcJ:ilmatieteenlaitos.fi/c/document_library/get_file%3Fuuid%3Ddaf66752-74a6-46d0-b390-f622df4c1c7a%26groupId%3D30106+&cd=5&hl=en&ct=clnk&gl=us
7 Dec 2002 00:33 Pietarsaari Kallan UTC 1060.2 https://en.ilmatieteenlaitos.fi/download-observations |
Korkein ilmanpaine 1060 hPa 7.12.20
April low https://twitter.com/mikarantane/status/1511249062082793475
Baltics[edit]

Maximum pressure in Europe 22-23 January 1907 recorded in Pärnu, Estonia and Riga, Latvia at 1067.1 mbar.[4] The Free University of Berlin state the European air pressure record is 23 January 1907 in Riga at 1068.7 hPa.[101]
Estonia[edit]
As reported by the Estonian Weather Service
- Highest air pressure: 23 January 1907, Tallinn 1060.3 hPa.‡
- Lowest air pressure: 16 December 1982 Väike-Maarja 936.0 hPa.
‡The Estonian Weather Service report on their website the record maximum observed air pressure in the country as 1060.3 hPa recorded 23 January 1907 in Tallinn.[102] This figure is not supported by NOAA reanalysis charts[103] and the values reported from neighbouring Finland and Latvia probably make this figure an underestimation or error. A possible maximum pressure value for the whole of Europe is thought to have occurred during the 22-23 January 1907 high pressure event with a record set in Pärnu, Estonia and Riga, Latvia at 1067.1 mbar.[4] Though this value is exceeded by the value on 23 January 1907 in Riga reported at 1068.7 hPa by the Free University of Berlin's student generated reports.[101]
| Month | Date | Location | pressure hPa | ref | Notes |
|---|---|---|---|---|---|
| January | 22 January 2006 | Kuusiku | 1058.1 | [104] | January 1907 |
| February | 1 February 2012 | Narva-Jõesuu | 1053.4 | [105] | |
| March | 16 March 2015 | Jõhvi | 1052.7 | [106] | |
| April | 2 April 2004 | Kihnu | 1037.9 | [107] | |
| May | 6 May 2006 | Kunda | 1039.0 | [108] | |
| June | 1 June 2009 | Lääne-Nigula | 1037.5 | [109] | |
| July | 2 July 2006 | Võru | 1033.6 | [110] | |
| August | 21 August 2015 | Lääne-Nigula | 1032.3 | [111] | |
| September | 28 September 2018 | Jõhvi | 1043.9 | [112] | |
| October | 31 October 2015 | Võru | 1041.6 | [113] | |
| November | 16 November 2018 | Valga | 1043.2 | [114] | 21 November 1993 Narva 1057.2. |
| December | 30 December 2015 | Valga | 1048.0 | [115] |
| Month | Date | Location | pressure hPa | ref | Notes |
|---|---|---|---|---|---|
| January | 11 January 2005 | Ristna | 962,6 | [116] | |
| February | 10 January 2019 | Ristna | 965.3 | [117] | |
| March | 26 March 2008 | Narva-Jõesuu | 966.6 | [106] | |
| April | 3 April 2020 | Pakri | 977.3 | [107] | |
| May | 2 may 2019 | Kunda | 977.1 | [108] | |
| June | 27 June 2007 | Ristna | 981.7 | [109] | |
| July | 9 July 2009 | Ristna | 986.6 | [110] | |
| August | 10 August 2005 | Kihnu | 985.0 | [111] | |
| September | 14 September 2017 | Vilsandi | 981.4 | [112] | |
| October | 29 October 2017 | Kunda | 972.4 | [113] | |
| November | 23 November 2008 | Tiirikoja | 951.3 | [114] | |
| December | 6 December 2013 | Vilsandi | 966.1 | [115] | 16 December 1982, Naissaar 947.6 hPa |
Latvia[edit]
- Highest air pressure: 22—23? January 1907 Liepāja 1065.9 hPa‡
- Lowest air pressure: 12 February 1962 Vidzeme Upland 932.9 hPa
http://www.meteolapa.lv/blogs/305/ciklons-un-anticiklons[better source needed] [118]
recent high 790 millimetres of mercury (1,050 hPa) 28-29 January 2012.https://www.apollo.lv/5898211/atmosferas-spiediens-augstakais-pedejo-tris-gadu-laika
probable ref for values... page 6 top. http://www.nauticalive.com/wp-content/uploads/2017/11/Meteorolog%CC%A7ija.pdf
Lithuania[edit]
23 January 1907 1065.1 hPa.[119]
Kaliningrad/Königsberg[edit]
- Highest 23 January 1907 1064.7 hPa[119]
European Russia[edit]
- 3 January 2008, Kargopol Arkhangelsk Oblast 1063.5 named as "Evi" by FUB.-http://www.met.fu-berlin.de/de/wetter/maps/Analyse_20080103.gif
- 30-31 January 1972, northwest Russia, south of Archangel (58°N, 44°E) 1064
- 16 December 1997, western Russia (53°N, 32°E) 1059 (60 km north of Gomel Belarus).

- 16 February 1956 centred over *16 february 1956, northern Urals 1070 hPa mentioned in student generated reports from FUB.[120] 1067 hPa in another student report from FUB.[101] Others give a figure for this high of 1065 mslp.-[121] isobar of 1072 over Russia on Met Office Daily Weather Report 16 February 1956 centred about the town of Vorkuta, [[Komi Republic].[122]
- 17 February 1954 N Russia >1060. http://www.wetterzentrale.de/pics/archive/ra/1956/Rrea00119560216.gif claimed over 1070 hPa by Free University Berlin.[123]
- 7 January 1907, St Petersburg in January 1907, when the barometer's arrow was shown at 1,064 hPa (798 mm Hg), are unmatched.[124]
... Источник: https://rueconomics.ru/277726-sinoptiki-peterburga-obyasnili-chem-vyzvano-anomalnoe-atmosfernoe-davlenie#from_copy
30- January 2012 "Dieter" 2012 1032 hPa!?! http://sputniknews.com/voiceofrussia/2012/01/30/64960457/
"Cooper" 29 January 2012, Repola Khoseda-Khard up to 1065.6 hPa mslp now ( 1053.1 hPa stattion reading ) -http://www.ukweatherworld.co.uk/forum/index.php?/topic/89180-pressure-watch-eastern-europe-27th-jan-onwards-10683-hpa-khoseda-khard-%E2%80%A2new-all-time-record%E2%80%A2/
- "Thomas"10/12/2012-25/12/2012 >1060 hPa 14/12/12.http://www.met.fu-berlin.de/de/wetter/maps/Analyse_20121214.gif http://neven1.typepad.com/blog/2012/12/looking-for-winter-weirdness-3.html

- Luisa" 17 March 2015 1054 hPa Yefimovsky http://www.wetteronline.de/wetterticker?postId=post_1615613
- Low Pressure Moscow 720.8 mm Hg!?!!? 11 January 2015 720mm= 28.3464567 inches = 959.811024 hectopascals, in 1941 the pressure has dropped to the level of 721 mm Hg.[125]
EMULATE data:
- Archangelsk pressure over 1060 hPa 4 times, 21 Jan 1907, 30 Jan 1920, 17 Feb 1956 and 30 Jan 1972. for period 1870-2000.[126]
- St Petersburg pressure over 1060 on 3 occasions, 16 January 1869 1061.74 hPa, 21-22 January 1907 1063.81 hPa, and 13 December 1946 1060.18 hPa 1850-2000.[127]
- Moscow has recorded pressure over 1060 on 4 occasions between 1866-2000, on 16 Jan 1869 1060.06 hPa, 5 December 1869 1060.44 hPa, 14 December 1944 1062.25 hPa and 31 January 1972 1061.28 hPa.
- http://latestnewsresource.com/da/news/v-moskve-zafiksirovali-rekordno-nizkoe-atmosfernoe-davlenie
- Kazan >1060: 25 Feb 1898 1060.97, 27 Nov 1910 1062.99, 30 Jan 1920 1065.12, 4 Jan 1969 1061.38, 31 Jan 1972 1060.76.https://crudata.uea.ac.uk/projects/emulate/LANDSTATION_MSLP/CORRECTED/EMULATE_KAZAN_TS_DIURNAL_AD.AS 1855-31 Oct 1941 1 Jan 1951-2000
773.2 millimetres of mercury (1,030.8 hPa)http://tass.ru/obschestvo/1833627
"Peter the great" Oct 2016 http://www.dwd.de/DE/wetter/thema_des_tages/2016/10/30.html
Average atmospheric pressure map january and july russia maps https://geographyofrussia.com/atmosfernoe-davlenie-v-rossii/
Moscow records[edit]
In Moscow, according to the available series of instrumental observations, the lowest pressure value - 945.3 hPa (709 mm Hg) - was noted on November 25, 1973, and the highest - 1042.3 hPa (782 mm Hg) - December 14, 1944.[129]
Moscow monthly[edit]
774.6 mm Hg of 1984https://it.sputniknews.com/mondo/201802145648961-russia-meteorologia-pressione-atmosferica/ ↑
- August Moscow record 25 August 1944, 761 millimetres of mercury (1,015 hPa).https://www.msk.kp.ru/daily/26718/3744441/
- September Moscow record 27 September 2017, 1022.6 hPa, previously 1973 27 September[130]
- November Moscow record unknown date November, 1034.6 hPa.[131]
↓
- January 2016 a record low atmospheric pressure was recorded in Moscow. So, the morning of January 13 the pressure dropped to 721.7 millimetres of mercury (962.2 hPa), which is a record since 1946. https://tvrain.ru/news/davlenie-419107/
- June 28 2019 728 millimetres of mercury (971 hPa).https://www.tellerreport.com/life/2019-06-28---in-moscow--recorded-a-record-low-pressure-.HJZCSBDQxB.html
St Petersburg monthly[edit]
↑
- September St Petersburg record unknown date 1906 - 1041.2 hPa.[124] On 26 September 2017 morning, atmospheric pressure in St. Petersburg reached 1042 hPa (782 mm Hg), exceeding the absolute September record for all the years of regular instrumental observations, which was noted in 1906 (1041.2 hPa).[130]
Scherhag[edit]
Neue Methoden der Wetteranalyse und Wetterprognose Richard Scherhag Springer-Verlag, 9 Mar 2013 https://books.google.co.uk/books?id=8WSXBwAAQBAJ&lpg=PA125&ots=bTCFSSh-Lf&dq=luftdruck%20hoch%201882%20januar&pg=PA126#v=onepage&q=luftdruck%20hoch%201882%20januar&f=false
- 23 Jan 1907 Riga 1068.6
- 13 Dec 1944 Kazan 1068.0
- 22 Jan 1907 Helsinki 1067.1
- 15 January 1940 Myggbukta, Greenland 1064.8
- 6 February 1895 Vardø, Norway 1059.1
- 23 January 1907 Hamburg 1056.7
- 9 January 1896 Fort William 1054.4
- 28 January 1929 Spitzbergen 1054.2
- 15 January 1892 Stykkisholmur 1053.8
- 21 February 1944 Faroe Islands 1053.0
- 16 January 1882 Hamburg 1048.8
- 26 January 1932 Hamburg 1048.7
- 26 January 1925 Hamburg 1046.7
- 13 January 1929 Seydisfjordur 1046.7
Belarus[edit]
>1060 23 January 1907 -http://www.wetterzentrale.de/pics/archive/ra/1907/Rrea00119070123.gif
Belarus state hydrometeorological service, The Center of Hydrometeorology, Radioactive Contamination Control and Environmental Monitoring
| Month | Date | Location | pressure hPa | ref |
|---|---|---|---|---|
| January | 4 January 1977 | Bragin (Brahin) | 1036.9 | [132] |
| February | 24 February 1976 in | Bragin | 1036.5 | [133] |
| March | 13 March 1995 | Polotsk | 1032.4 | [134] |
| April | 16 April 2003 | Verhnedvinsk (Verkhnyadzvinsk) | 1021.6 | [135] |
| May | 28 May 1968 | Polotsk | 1023 | [136] |
| June | 3 June 1979 | Grodno | 1016.3 | [137] |
Maximum air pressure at station level recorded October 28, 1987 in Bragin Brahin- 1033.9 hPa (777 mmHg) at a rate on this item 1005.5 hPa (756 mm Hg).
Maximum air pressure at station level recorded September 29, 1986 in Bragin - 1023.3 hPa (769 mm Hg) at a rate on this item 1002.7 hPa (754 mm Hg).
| Month | Date | Location | pressure hPa | ref |
|---|---|---|---|---|
| January | 4 January 1981 | Novogrudok (Navahrudak) | 941.6 | [132] |
| February | 5 February 1999 in | Novogrudok | 939.9 | [133] |
| March | 27 March 1995 | Navahrudak | 943.2 | [134] |
| April | 11 April 1997 | Novogrudok | 944.6 | [135] |
| May | 5 May 1998 | Novogrudok | 951.9 | [136] |
| June | 16 June 1985 in Novogrudok | Novgrudok | 958.9 | [137] |
there was September 6, 1992 The absolute minimum air pressure at station level, in Novogrudok - 954.1 hPa (717 mmHg) at a rate of 982.6 hPa (739 mm Hg).[138]
The absolute minimum air pressure at station level observed 21 October 1996 at the Polesskaya http://www.geographic.org/global_weather/belarus/poleskaya_015.html(52.3000 Longitude in decimal degrees: 26.7000 - 945.7 hPa (711 mm Hg).
Jersey[edit]
France[edit]
Météo-France figures from 1951-2012.[140]
- Highest air pressure: 3 March 1990, Pointe de Chémoulin, Saint-Nazaire Loire-Atlantique 1048.9 hPa.[141]
- Lowest air pressure: 25 February 1989, Cap de La Hague, Cherbourg 951.8 hPa.[141]
"A titre de comparaison, on citera le record de pression au niveau de la mer mesuré en France : 948 hPa le 16 octobre 1987 à Ouessant"-http://www.annales.org/ri/2002/425/bessemoulin009-14.pdf though http://www.europeanwindstorms.org/cgi-bin/storms/storms.cgi?storm1=Great87 gives minimum ~956 from reanalysis.
though other figures are also listed which predate Météo-France's records.[citation needed]
- Highest air pressure: 6 February 1821 Paris 1050 hPa.
- Lowest air pressure: 25 December 1821 Boulogne sur mer 947.1 hPa.
29 January 1905, a powerful anticyclone covers all of Europe and the atmospheric pressure reached a record value of 1049.3 hPa in Paris.[142][143]
local record high values Yörn 2016 http://www.keraunos.org/actualites/fil-infos/2016/decembre/anticyclone-decembre-2016-record-pression-france-stabilite-orages-deficit http://www.meteo-express.com/actualite/28-12-16.html
On 28 January 1905 values of 31.04 inches of mercury (1,051 hPa) in Biarritz, and 31.01 inches of mercury (1,050 hPa) in Brest are listed in the Met Office Daily Weather Report.[144]
http://visualiseur.bnf.fr/ark:/12148/bpt6k3050z (search Renou)
Monthly maximum[edit]
| Month | Date | Location | pressure hPa | ref | Notes |
|---|---|---|---|---|---|
| January | 20 January 2020 | Abbeville | 1049.7 | ||
| February | 6 February 1821 | Paris | 1050 | https://www.meteo-paris.com/actualites/pressions-atmospheriques-exceptionnelles-sous-l-anticyclone-yorn-28-decembre-2016.html | *Possibly: February 15, 1934 Cap De La Hague 1,048.2 hPa.[145] |
| March | 3 March 1990 | Pointe de Chémoulin, Saint-Nazaire Loire-Atlantique | 1048.9 hPa | ||
| May | 13 May 2019 | Dunkirk | 1040.7 | [146][147] | |
| September | 25 September 2018 | Valenciennes | 1040.0 | [148] | *Previously 19 September 1986 Dunkirk 1038.4 [149] |
Monthly min[edit]
|- | October | | | | | *Possibly (very tentative) 15 October 1987, Brest 957 hPa.[150] Ushant is claimed to have reported a pressure of 948 hPa on this date.[151] Brest-Guipavas described as an absolute record for the station since 1945, 948 hPa.[152]
October *Possibly 15 October 1987 Ouessant 948 hPa.[153] Ushant 948, Brest 957 -http://tempetes.meteo.fr/spip.php?article129
December 25, 1991:
1044.8 hPa in Lille http://twitter.com/pablosanchez_tv/status/813699873300217856
https://www.infoclimat.fr/climatologie/normales-records/1981-2010/lille-lesquin/valeurs/07015.html
Corsica[edit]
https://twitter.com/GaetanHeymes/status/1056981881487609857 Pression minimale 979 hPa à Calvi record mensuel pour la Corse non loin du record absolu 975 hPa au Cap Corse en mars 2009.
Belgium[edit]
The Belgian Royal Meteorological Institute gives the national record values as:
1882 date claim for 1048 max http://www.meteobelgie.be/klimatologie/artikels-en-dossiers/allerlei/1099-de-klimatologische-records.html
1048,2 hPa à Elsenborn 27 December 2016 https://www.facebook.com/geoclimat.org/posts/1294877337239718:0 Meteobelgique.com give lower Uccle value https://www.meteobelgique.be/article/releves-et-analyses/annee-2016/2183-resume-decembre-2016.html
Chievres https://twitter.com/ZdenekNejedly/status/1219157455415971841
- Lowest air pressure: 25 February 1989, Blankenberge 954 hPa.[154]
| Month | Date | Location | pressure hPa | ref |
|---|---|---|---|---|
| May | 13 May 2019 | Uccle | 1039.2 | https://twitter.com/DDehenauw/status/1127966220882513920 |
| June | 6 June 1962 | Uccle | 1034.9 | [155] |
| September | 27 September 1906 | Uccle | 1037.9 | [155] |
| October | 23 October 1958 | Uccle | 1039.5 | [155] |
| Month | Date | Location | pressure hPa | ref | |
|---|---|---|---|---|---|
| February | 25 February 1989 | Uccle | 956.8 | [155] | *Alt On 25 February 1989 a value reported at Blankenberge of 954 hPa.[155][154] |
| August | 24 August 1956 | Uccle | 980 | [155] | |
| September | 11 September 1903 | Uccle | 976.8 | [155] | |
| October | 10 October 1964 | Uccle | 971.0 | [155] | |
| November | 29 November 1965 | Uccle | 967 | [155] |
Netherlands[edit]
The Dutch Royal Netherlands Meteorological Institute lists the following as national records:
A value on 23 januari 1907 of 1053.0 hPa in Eelde is also given online.[157][158]
- KNMI Lowest air pressure: 27 November 1983, Eelde, Drenthe 954.2 hPa.http://www.knmi.nl/cms/content/28293/lage_luchtdrukrecords[98][159]
On 26 January 1932 was in De Bilt measured a pressure of 1050.0 hPa, the highest pressure ever by KNMI measured. The air pressure was extremely high for several days: averaged over 48 hours was calculated in De Bilt 1048 hPa. On 23 January 1907, the air pressure in De Bilt rose to 1047.9 hPa and on 23 December 1962 1047.8 hPa was measured. The highest pressure values are typically in the winter months is measured. In the summer barometers suggest rarely above 1035 hPa and also the daily pressure variations much smaller than in other seasons. In the fall, especially from mid-October, the air pressure can change from day to day and quickly be measured as a rule the lowest values. Thus, the air pressure in July in De Bilt never come higher than 1033 hPa and for August is the age record at 1034 hPa. The wintry pressure areas are known for their high pressure values. Especially above Siberia comes in the winter often pressure for more than 1050 hPa. On December 31, 1968 was in place Agata in Siberia (350 km southeast of Norilsk ) established a record of 1083.8 hPa. This is up to now still reduced the highest value up to sea level air pressure ever recorded in the world. Most home-garden and kitchen barometers indicate that value even once. The lowest air pressure ever by the KNMI is measured in De Bilt is 956.4 hPa on 26 February 1989 . In Flushing was that day measured a pressure of 954.4 hPa, but the age record for the Netherlands amounts to 954.2 hPa, measured on November 27, 1983 in Eelde . The century record of the pressure on the British Isles is 936 hPa measured in the night of 19 on December 20 1982 in northwest Scotland . On 26 January 1884, the air pressure in Scotland was even lower, to 925.6 hPa.
Luchtdrukextremen: De laagste luchtdruk die ooit in De Bilt is gemeten bedraagt 956,4 hPa op 26 februari 1989. In Vlissingen werd die dag een luchtdruk gemeten van 954.4 hPa, maar het eeuwrecord voor ons land bedraagt 954.2 hPa, gemeten op 27 november 1983 in Eelde. Op 26 januari 1932 werd in De Bilt een luchtdruk gemeten van 1050,0 hPa, de hoogste druk ooit door het KNMI gemeten. De luchtdruk was toen enkele dagen achtereen extreem hoog: gemiddeld over 48 uur werd in De Bilt 1048 hPa berekend. Op 2 februari 1993 werd in De Bilt een barometerstand bereikt van 1042 hPa en gemiddeld over de eerste tien dagen (decade) van die maand bedroeg de luchtdruk in De Bilt 1036 hPa, een nieuw record voor deze periode. Het record voor november bedraagt 1044.2 hPa en voor december 1047.0 hPa.-http://www.meteolink.nl/weer-records-nederland-en-de-wereld/
High pressure record for March 2003 -http://www.knmi.nl/cms/content/16712/maart_2003_hoogste_luchtdruk_in_maart
http://weergegevens.nl/extremes_mon.aspx?station=9999999&extreem=X_PG&order=2&maand=12&country=3&iscomplete=True&include=True===Netherlands monthly maximum figures for atmospheric pressure===
Netherlands monthly minimum figures for atmospheric pressure[edit]
- January Low pressure record for 23 january 2009 Hoek van Holland, 961.0 hPa.-http://www.knmi.nl/cms/content/7855/uitzonderlijk_lage_barometerstanden cyclone Klaus
- May Low pressure record for 5 May 2000 De Bilt 983.5 hPa, which surpassed the previous record set on 13 May 1867 at 984,3 hPa.-http://www.knmi.nl/cms/content/11553/luchtdrukrecord_voor_mei_2000
- 27 November 1983, Eelde, Drenthe 954.2 hPa
Schorse in Europe. 26 September 2018 -http://www.severe-weather.eu/mcd/a-record-breaking-high-pressure-system-across-central-europe-today-sept-26th/
- https://twitter.com/JillPeetersWX/status/1044968940521377799
- https://twitter.com/meteoSI/status/1044498114235772928
- https://www.3bmeteo.com/giornale-meteo/meteo-europa---alta-pressione-da-record-anche-in-italia--tutti-i-dettagli-208553
- https://www.facebook.com/ArsoVreme/posts/2156283591062371
- https://www.facebook.com/geoclimat.org/photos/a.832272180166905/2016536188407159/?type=3&theater
- https://twitter.com/i/status/1045347486683066369
Xerxes
Germany[edit]
The German weather service (DWD) give the
- Highest air pressure: 23 January 1907,Greifswald, Mecklenburg-Vorpommern 1060.8 hPa.[160]http://www.dwd.de/bvbw/generator/DWDWWW/Content/Presse/Broschueren/Wetterrekorde__PDF,templateId=raw,property=publicationFile.pdf/Wetterrekorde_PDF.pdf
- Lowest air pressure: 27 November 1983 in Emden, Lower Saxony at 954.4 hPa.Cite error: The opening
<ref>tag is malformed or has a bad name (see the help page).
Other figures and locations are also presented as -https://wdnow.wordpress.com/2012/01/12/hochdruck-und-tiefdruck-lufdruckrekorde-in-deutschland/
- 23 January 1907 Dahlem (Berlin) 1057.8 hPa.[118][161] claimed this is an incorrect correction to mslp and correct value is 1056.7 hPa.-http://www.wzforum.de/forum2/read.php?7,1734185,1734847#msg-1734847
http://wetterkanal.kachelmannwetter.com/neue-luftdruckrekorde-durch-hoch-yoern/
Alternative values on the internet
- 27 November 1983 Bremen 955.4 hPa.[118][161] which is not lower than the DWD value.
- 26 February 1989 in Osnabrück 949.5 hPa. http://wetterstation-geislingen.de/wetterrekorde.html 948.6 [162]
- 16 January 1882 sw e germany >1050-http://meteolive.leonardo.it/meteoforum/post507864.html
Germany monthly maximum figures for atmospheric pressure[edit]
| Month | Date | Location | pressure hPa | Altitude (m) | ref | Notes |
|---|---|---|---|---|---|---|
| January | 23 January 1907 | Greifswald, Mecklenburg-Vorpommern | 1060.8 | National record. | ||
| February | 15 February 1959 | Mühldorf, Bavaria | 1050 | 405.6 | ||
| March | 4 March 1990 | Garmisch Partenkirchen, Bavaria | 1048.5 | 719 | ||
| April | 21 April 2002 | Greifswalder Oie, Mecklenberg Vorpommern | 1039.3 | 12 | Based on Berlin record.[164] | |
| May | 13 May 2019 | Norderney, Lower Saxony | 1041.1 | 11.47 | Based on NL record. | |
| June | 7 June 1962 | List on Sylt, Schleswig-Holstein | 1037.8 | 24.7 | Based on NL & DK. | |
| July | 16 July 2006 | Waren (Müritz) | 1034.3 | 72.6 | Based on Berlin. | |
| August | 4 August 1981 | Neustadt an der Weinstraße, Rhineland-Palatinate | 1038.3 | 163 | Based on Berlin | |
| September | 29 September 2015 | Schönhagen (Ostseebad), Schleswig-Holstein | 1041.4 | 0.79 | Based on former NL and DK. | |
| October | 18 October 1993 | Parow Airport | 1042.8 | 4 | Based on Berlin. | |
| November | 18 November 1985 | Arkona | 1046.5 | 42 | Based on DK, offshore same value at Kiel Leuchtturm. | |
| December | 23 December 1963 | Berlin Tempelhof Airport | 1049.6 | 48 |
Germany monthly minimum figures for atmospheric pressure[edit]
| Month | Date | Location | pressure hPa | ref |
|---|---|---|---|---|
| January | 23 January 2009 | Kalkar, North Rhine-Westphalia | 963.7 | [165]alt 31m Based on nl FUB "Joris" |
| February | 26 February 1989 | Norderney | 957.9 | alt 11.47 m based on nl, pl, Berlin |
| March | 25 March 1986 | List on Sylt | 960.8 | CDC based on dk |
| April | 7 April 1959 | List on Sylt | 979.6 | 24.7m |
| May | 6 May 1997 | Eggebek, | 982 | 17m based on Berlin |
| June | 26 June 2007 | Arkona, MKBVP | 984.7 | Based on Berlin, Augsberg 966.2 hPa 18:00 5 June 1977 appears to be an erroneous value. |
| July | 18 July 1954 | Schleswig | 983.9 | 18 July 1954 bad data, based on Berlin |
| August | 25 August 1956 | Lingen, Lower Saxony | 974.6 | DWD CDC based on Berlin |
| September | 21 September 1990 | List on Sylt | 976.3 | Based on Berlin. |
| October | 27 October 1959 | List on Sylt | 969.1 | Based on nl, Berlin only value 968.6 hPa am 7 October 1901.[166] |
| November | 27 November 1983 | Emden | 954.4 | National record. DWD CDC |
| December | 16 December 1962 | List on Sylt | 960.7 | Based on Berlin |
German States[edit]
- Baden-Württemberg
- Bavaria
- 1882
- 1907 23 January Bamberg 782.8 millimetres of mercury (1,043.6 hPa). seewarte 24 Jan morning Munich 30.80 inches of mercury (1,043 hPa) UK Met DWP
- 1959, 15 February Mühldorf 1050 at 9am -DWD Climate Data Center.
- "Ekart" 21 January 2020 Oberstdorf 1050.0 hPa (806m altitude)[169][dubious – discuss] 20 January 2020 Nuremburg 1047.9 hPa.[170]
- 18 February 2015 Straubing and Fürstenfeld, 1043.3 hPa.[171]
- 1976, 2 December 06:00 Würzburg (3 hourly readings) 969.6 hPa.-DWD CDC
- Berlin
- Berlin Tempelhof 23 December 1963 1049.6 (21:00 reading, every 3 hrs).-DWD CDC
| Month | Max Date | Maximum pressure hPa | Min Date | Minimum pressure hPa | Notes |
|---|---|---|---|---|---|
| January | 23 January 2006 | 1049.8 | 17 January 1955 | 966.6 | 23 January 1907 1056.6 hPa.[172] |
| February | 16 February 1959 | 1048 | 26 February 1989 | 965.2 | |
| March | 15 March 2003 | 1044.7 | 1 March 1990 | 972.7 | |
| April | 21 April 2002 | 1037.5 | 7 April 1959 | 983.5 | |
| May | 2 May 1990 | 1037.5 | 6 May 1997 | 984.4 | |
| June | 13 June 1957 | 1035.0 | 26 June 2007 | 992.6 | |
| July | 16 July 2006 | 1032.4 | 18 July 1954 | 989.6 | |
| August | 4 August 1981 | 1031.5 | 25 August 1956 | 984.2 | |
| September | 7 September 1953 | 1038.5 | 21 September 1990 | 987.2 | |
| October | 18 October 1993 | 1042.1 | 22 October 1974 | 979.3 | |
| November | 21 November 1998 | 1043.3 | 27 November 1983 | 966.8 | |
| December | 23 December 1963 | 1049.6 | 16 December 1962 | 970.2 | 1049.4 FU Berlin value |
- Brandenburg
- 1907, 22 January 1907 Potsdam 1049.42 -CRU Emulate data.
- 1991, 10 December 1991 Potsdam 1048.08 -CRU Emulate data.
- 1989, 26 Feb 14:00 UTC Potsdam 963.9 hPa.-DWD CDC
- 1907, 22 January 1907 Potsdam 1049.42 -CRU Emulate data.
- Bremen
- 1907
- 16 Feb 2008 Bremerhaven 1048.
- 1983, 27 November Bremen 955.4 hPa 14:00 hrs. DWD cdc
- Hamburg
- 1907, 23 January Hamburg 791.9 millimetres of mercury (1,055.8 hPa) 08:00 morning reading Deutsche Seewarte. 23 January 1907 Hamburg 1056.7.Neue Methoden der Wetteranalyse und Wetterprognose Richard Scherhag Springer-Verlag, 9 Mar 2013 https://books.google.co.uk/books?id=8WSXBwAAQBAJ&lpg=PA125&ots=bTCFSSh-Lf&dq=luftdruck%20hoch%201882%20januar&pg=PA126#v=onepage&q=luftdruck%20hoch%201882%20januar&f=false
- 1047,7 hPa am 16.02.2008
- 1907, 23 January Hamburg 791.9 millimetres of mercury (1,055.8 hPa) 08:00 morning reading Deutsche Seewarte. 23 January 1907 Hamburg 1056.7.Neue Methoden der Wetteranalyse und Wetterprognose Richard Scherhag Springer-Verlag, 9 Mar 2013 https://books.google.co.uk/books?id=8WSXBwAAQBAJ&lpg=PA125&ots=bTCFSSh-Lf&dq=luftdruck%20hoch%201882%20januar&pg=PA126#v=onepage&q=luftdruck%20hoch%201882%20januar&f=false
- 25 December 1821 Hamburg 956.4 hPa.[174]
- Hesse
- 15 February 1959 Frankfurt Airport 1048.0 hPa.[168]
- Lower Saxony
- Highest 23 January 1907...Deutsche Seewarte 23 Jan 1907 8:00 am reading at Cuxhaven 791.1 millimetres of mercury (1,054.7 hPa).
- Lowest: 27 November 1983 in Emden, Lower Saxony at 954.4 hPa.
- Mecklenburg-Vorpommern
- 23 January 1907,Greifswald, Mecklenburg-Vorpommern 1060.8 hPa
Arkona value and Seewarte value 8 am 23 January Wustrow 794.4 millimetres of mercury (1,059.1 hPa).
- 1991, December 10 Goldberg 1049.0 hPa.DWD CDC
- 1997, December 16 Ueckermünde 1043.8 hPa.DWD CDC
- North Rhine-Westphalia
- ~probably Feb 1959, the over 60 year old record Essen 1047.8[175]
- 17 February 1959 Aachen 1045.6 hPa.https://wetterkanal.kachelmannwetter.com/luftdruck-im-bereich-der-rekordwerte/ 1932?
- 20 January 2020 Cologne Bonn Airport 1049.4 hPa.[170]
- 1907, 23 Jan 8 am reading Aachen 785.0 millimetres of mercury (1,046.6 hPa).-seewarte
ologne-Bonn the record should be 1049.7 hPa from February 1959...
- 1983, 27 November 14:00 and 15:00 UTC Bad Salzuflen 963.2 hPa.-DWD CDC
- 2009, 23 January 14:00 UTC Kalkar 963.7 hPa.-DWD CDC
- 1990, 28 February 20:00 UTC Essen-Bredeney 964.8 hPa.-DWD CDC
- Rhineland Palatinate
- Yörn or February 15, 1959 Trier-Petrisberg, 1047.4 hPa.[167]
- Saarland
- 15 February 1959 Saarbrücken Airport 1047.4 hPa.[168]Supported by 09:00 reading DWD CDC.
- Saxony
- 1907 23 January Dresden 791.1 millimetres of mercury (1,054.7 hPa)
- 2020, 20 January Plauen 1048.5 hPa 20:00 hrs DWD Climate Data Center
- 1907 23 January Dresden 791.1 millimetres of mercury (1,054.7 hPa)
- Saxony-Anhalt
- 1907 23 January Magdeburg 790.8 millimetres of mercury (1,054.3 hPa) seewarte
- Schleswig-Holstein
- 1907, 23 January 8am Keitum (Sylt) 792.8 millimetres of mercury (1,057.0 hPa).-seewarte
- Thuringia
- 1907 CRU Emulate data 23 January 1907 Jena 1048.44
- 1881 CRU Emulate data 16 January 1881 Jena 1047.1
- 1907 CRU Emulate data 23 January 1907 Jena 1048.44
- CRU Emulate give readings ~1046 in location 11/11/1859, 17/1/1882, 27/1/1932, 23/12/1963, and a reading 11/5/1992 (which might be a mistake (though values above 1040 in preceding week, though doesn't fit numbers either side or have support from reanalysis charts)).
CRU low Jena
- 1) 26 Feb 1989 969.32
- 2) 2 Dec 1976 972.58
- 3) 25 Feb 1989 975.37
- 4) 27 Nov 1983 975.39
- 5) 20 Jan 1873 977.30
- 16 December 2011 Jena 972 hPa (storm Joachim) since 1999.[176][better source needed]https://www.jenaer-nachrichten.de/stadtleben/12537-das-wetter-eah-jena-misst-rekordhoch http://wetter.mb.eah-jena.de/station/index.html
-CDC DWD lowest during Joachim as being 963.8 minima in Brunswick and Lugde-Paenbruch
- 1976 December 2 972.58 Emulate data
Central Europe[edit]
Switzerland[edit]
- QFE P at location, QNH mean SLP, QFF mean SLP + temp.
- A high pressure from MeteoSwiss: 16 January 1882 at Zürichberg 1047 hPa.
Other high pressures in Switzerland are given as 29 January 1989 Schaffhausen 1047.2 hPa, which was the highest pressure in the country since the 1950s, when values on 15 February 1959 at Kloten 1047.1 hPa.[177][178] A high value of 1050.2 hPa at Bern on 17 January 1882 is proposed as having occurred (on an internet forum).[179]
15 February 1959 unknown location 1045 hPa.[180] Other high values are given as http://www.meteosuisse.admin.ch/home/actualite/meteosuisse-blog.subpage.html/fr/data/blogs/2016/12/une-pression-atmospherique-record--.html
- 27–28 December 2016 record value at astation since 1949, (not MSLP value) http://www.meteoschweiz.admin.ch/home/aktuell/meteoschweiz-blog.subpage.html/de/data/blogs/2016/12/luftdruck-in-zuerich-in-rekordhoehe.html http://www.meteosvizzera.admin.ch/home/attualita/meteosvizzera-blog.subpage.html/it/data/blogs/2016/12/pressione-alle-stelle.html
Yörn http://wetter.li/de/News/N5678/Dezember-2016_-Ein-Monat-voller-Rekorden%21 unreduced http://wetter.li/de/News/N5675/Rekordhoch-Y%C3%B6rn-beschert-uns-extremen-Luftdruck%21 http://meteonews.ch/de/News/N5675/Rekordhoch-Y%C3%B6rn-beschert-uns-extremen-Luftdruck! http://www.srf.ch/meteo/meteo-news/dezember-2016-rekorde-bei-sonnenschein-und-trockenheit http://www.tagesanzeiger.ch/wissen/natur/Hoch-Yoern-bringt-Luftdruck-wie-seit-Jahren-nicht-mehr/story/19192335 http://wetterkanal.kachelmannwetter.com/neue-luftdruckrekorde-durch-hoch-yoern/
Switzerland monthly maximum figures[edit]
| Month | Date | Location | pressure hPa | ref | Notes |
|---|---|---|---|---|---|
| January | 29 January 1989 | Schaffhausen | 1047.2 | Alt 17 January 1882 Zürichberg 1047 | |
| February | 15 February 1959 | Kloten | 1047.1 | [181][178] | Alt 15 February 1959 unknown location 1045[182] |
| March | 3-4 March 1990 | Zürich Airport | ~1047 | [183] | |
| April | 7 April 2015 | Zürich-Fluntern | 1036.5 | [184][185] | since 55 years (measurement) at station (not national) |
| May | 22 May 1991 and 13 May 2019 | Zurich Kloten | QFE: 981.1 hPA, QNH: 1032.2 hPA | https://twitter.com/srfmeteo/status/1127890549137117184 https://www.srf.ch/meteo/meteo-news/europawetter-kraeftiges-hoch-ueber-der-nordsee | |
| September | 26 September 2018 | Neuchâtel | 978.2 hPa (ou 1036.2 hPa pour le QNH) | [186] | Romandy only |
| December | 26 December 2016 |
Switzerland monthly minimum figures for barometric pressure[edit]
| Month | Date | Location | pressure hPa | ref | |
|---|---|---|---|---|---|
| October | 29-30 Octber 2018 | Swiss | https://www.meteoschweiz.admin.ch/content/dam/meteoswiss/de/service-und-publikationen/Publikationen/doc/201810_d.pdf | Named Vaia FUB *October 2018 Vaia depression https://www.meteosuisse.admin.ch/content/dam/meteoswiss/fr/service-und-publikationen/publikationen/doc/201810_f.pdf?topic=/content/meteoswiss/tags/topics/klima |
7 April 2015, Zürich-Fluntern a new record for April since 55 years was measured with a station pressure of 968.2 hPa (1036.5 hPa reduced to mean sea level). https://www.facebook.com/meteocentrale.ch/posts/1349469565087884
Bern highest pressure since measurement began a new all-time record was registered at the station with 976.1 hPa (equivalent to sea level 1045.7 hPa)[187] Thus the record value of 4 March 1990 was exceeded by 0.1 hPa.[188]
http://www.prevision-meteo.ch/climat/mensuel/bischofszell/2016 469 alt 1048.3 hPa.
Liechtenstein[edit]
A private weather station in Balzers, southwest Liechtensterin reported on 28 December 2016 a value of 1046.4 hPa under the high named Yörn.[189]
Austria[edit]
- Deutsche Seewart weather summary gives a value on the morning of 24 January 1907 in Vienna as 790.7 millimetres of mercury (1,054.2 hPa).[190]
- A high pressure on 16 January 1882 northern Austria >1050-http://meteolive.leonardo.it/meteoforum/post507864.html, 16 January 1882 Vienna 1050.5 hPa, the highest there since 1775.[4]
- 21 January 2020 Imst 1050.7 hPa.https://wetter.tv/de/a/extrem-hoher-luftdruck 2020 Austia state high values https://www.heute.at/s/wetter-in-osterreich-luftdruck-ist-derzeit-extrem-hoch-50283730#:~:text=Wo%20genau%20ist%20der%20Luftdruck,3%20hPa%20in%20Reutte%20gemessen
- A low pressure could possibly be 2 or 3 Dec 1976 (Based on HU and CZ records) <970 hPa.
746.2 millimetres of mercury (994.9 hPa) klagenfurt-http://www.zobodat.at/pdf/Car-I_72_0074-0076.pdf
Poland[edit]
- In Poland the record high pressure is listed on 16 December 1997 with 1054.4 hPa recorded in Suwalki.
It is likely 23 January 1907 saw a pressure of 1064.8 ± 0.5 mbar over polish territory.[119] Other high pressures are reported as 1051.1 hPa January 22, 2006, 1050 hPa January 3, 1993 and 1048 hPa 10 December 1991.
Reanalysis data show a low record likely occurred on 17 January 1931 when a below 960 hPa low moved over the Baltic skirting the very north of today's Polish territory.[192]
Czech Republic[edit]
A pressure value above >1050 hPa is also proposed on internet forums on 16 January 1882.[194]
- Lowest (26?) February 1989 Čáslav 967 hPa appeared in press citing a Czech Hydrometeorological Institute employee.[195]
Alternate low records are cited on the internet: 26 February 1989 at Mariánské Lázně 967,3 hPa,[193] also 2 December 1976 Hradec Králové 970.1 hPa.[118]
since 1950 above 1046 in 1959, 1991, 2006, 2019.https://www.in-pocasi.cz/clanky/vyznacne/vyse-evropa-19.1.2020/
Slovakia[edit]
>absolute record fell in 1907, when the air pressure in our territory was around 1055 hPa.-https://www.topky.sk/cl/10/1854365/Na-Slovensko-sa-vali-rekordne-vysoky-tlak--Varovanie--Toto-nam-hrozi
- Czech met soc estimate pressure in Slovakia 1907 ~1060 hPa.
- Lowest air pressure: unknown, possibly 2 or 3 December 1976 (based on CZ and HU records) <970 hPa.-http://www.wetterzentrale.de/pics/archive/ra/1976/Rrea00119761203.gif
Hungary[edit]
The Hungarian Meteorological Service (OMSZ) gives the following values:
- Highest air pressure: 24 January 1907 Budapest 1055.9 hPa.[197]
- Lowest air pressure: 2 December 1976 Nagykanizsa 968.6 hPa.[197]
Slovenia[edit]
The Slovenian Environment Agency tweeted that pressure on 20 January 2020 reached 1048 hPa, slightly below the values seen on January 24 1907 and 24 December 1963.[198]
- A high pressure: 30 January 1989 Ljubljana and Novo Mesto, 1047 hPa.
During this high pressure Maribor Airport and Murska Sobota saw a peak of 1046 hPa, in Nova Gorica 1040 hPa and 1039 hPa in Portoroz.[199]
- A low pressure: 30 January 2015, in the middle of the day, the air pressure in our unusually low, the conversion value at sea level will amount to only about 970 hPa (ie. Mbar), which will be among the lowest levels in decades.[200]
Nad osrednjo in jugovzhodno Evropo se je zadrževal izjemno močan anticiklon, v Sloveniji so bile izmerjene rekordno visoke vrednosti zračnega tlaka. Ob 7. uri zjutraj je tlak, preračunan na morski nivo, v Murski Soboti znašal 1052 hPa, v Mariboru 1051 hPa, v Novem mestu 1050 hPa in v Ljubljani 1049 hPa.
attributed to ARSO 24 December 1963, An extremely strong anticyclone hovered over Central and South-Eastern Europe, and record high air pressure values were measured in Slovenia. At 7 o'clock in the morning, the pressure, calculated at sea level, was 1052 hPa in Murska Sobota, 1051 hPa in Maribor, 1050 hPa in Novo mesto and 1049 hPa in Ljubljana. https://www.slovreme.net/preteklost.asp?l=2016&m=12&d=24 http://mbizilj.blogspot.com/2012/12/zanimivi-vremenski-dogodki-24-decembra.html https://twitter.com/vremenolovec/status/1219324734678192129/photo/1
1048 hPa 5 January 1993-https://web.archive.org/web/20160204103519/http://meteo.arso.gov.si/uploads/app/text.html?/uploads/probase/www/climate/text/sl/onThisDay.html
Croatia[edit]
- Highest air pressure: January 1907 Gradec, Zagreb 1049 hPa.[201]
(provisionally) 20 January 2020 Maksimir, Zagreb 1047.8 hPa.[202]
- Previously 17 February 2008, 1047.0 hPa.
CRU Emulate data Zagreb 1862-2000 https://crudata.uea.ac.uk/projects/emulate/LANDSTATION_MSLP/CORRECTED/EMULATE_ZAGREB_TS_DIURNAL_A.ASC 1050.99 24 January 1907 1047.50 15 Jan 1882 1045.75 13 Feb 1959
Romania[edit]
Deutsche Seewarte give an evening reading on 24 January 1907 Sibiu (Hermannstadt) 791.1 millimetres of mercury (1,054.7 hPa).[190]
Serbia[edit]
Deutsche Seewarte give an evening reading on 24 January 1907 Belgrade of 791.2 millimetres of mercury (1,054.8 hPa).[190]
Ukraine[edit]
Kiev CRU Emulate 1907 1 23 1057.78
1907 1 24 1056.48
Italy[edit]
- A high pressure: 16 January 1882, Turin 1049.3 hPa.-http://datimeteoasti.it/landamento-del-clima-a-torino-dal-settecento-a-oggi/
- A low pressure: 2 December 1976, Turin 971.7 hPa.[203][204]-http://datimeteoasti.it/landamento-del-clima-a-torino-dal-settecento-a-oggi/
17 February 2008, 1043.7 hPa -http://www.mirandolameteo.it/recordstorici.html Pressione atmosferica massima 1042.6mb at Rome on 16th.https://www.netweather.tv/forum/topic/67928-high-pressure-dominated-middle-of-january-1882/ Trieste 1046. 16 jan 1882 and similar 17 feb 2008 1046-http://www.umfvg.org/drupal/node/203
Emulate data 16 January 1882 and 24 January 1907 in Milan both at 1046.7 hPa.-https://crudata.uea.ac.uk/projects/emulate/LANDSTATION_MSLP/CORRECTED/EMULATE_MILAN_TS_DIURNAL_AD.ASC Emulate dirunal value Padua 1046.56 24 January 1907
1882 gazeta ufficiale del regno d'italia. 16 feb, https://books.google.co.uk/books?id=Y5BQAAAAYAAJ&lpg=PA1084&ots=YgNmDI589g&dq=alta%20pressione%20italiano&pg=PA740#v=onepage&q=alta%20pressione%20italiano&f=false 17 feb, https://books.google.co.uk/books?id=Y5BQAAAAYAAJ&lpg=PA756&ots=YgNmDI6aej&dq=pressione%20febbraio%201882&pg=PA756#v=onepage&q=pressione%20febbraio%201882&f=false 20 feb, https://books.google.co.uk/books?id=Y5BQAAAAYAAJ&lpg=PA1084&ots=YgNmDI589g&dq=alta%20pressione%20italiano&pg=PA796#v=onepage&q=alta%20pressione%20italiano&f=false
Turin http://datimeteoasti.it/landamento-del-clima-a-torino-dal-settecento-a-oggi/ The minimum atmospheric pressure: 971.7 hPa (December 2nd, 1976) [ card 500 hPa , paper 850 hPa ] The maximum atmospheric pressure: 1049.3 hPa (16 January 1882) [ card 500 hPa , paper 850 hPa ] "Il clima di Torino", published in 2008 Gennaro di Napoli and Luca Mercalli
~January 21 2020~
- Concordia Sagittaria, Veneto 1048 hPa.[205][206]
- Bolzano, South Tyrol, 1048 hPa.[207]
RIVISTA AGRARIA METEOROLOGICA DELL' ANNO 1882 https://www.jstor.org/stable/45248215?read-now=1&refreqid=excelsior%3A4eb8170cd3c7e29b29c3aff8006e6032&seq=7#page_scan_tab_contents
Italy monthly maximum figure for atmospheric pressure[edit]
Italy monthly minimum figures for atmospheric pressure[edit]
| Month | Date | Location | pressure hPa | ref | Notes 1 | CRU EMULATE diurnal pressure 1850-1998 |
|---|---|---|---|---|---|---|
| January | 23 January 1897 | Turin | 978.0 | [203] | *investigate 29 January 2015 968 (not found)hPa http://www.arpa.veneto.it/temi-ambientali/meteo/riferimenti/documenti/documenti-meteo/20150210_Pressione_Gennaio.pdf | CRU EMULATE Milan 23 Jan 1897 982 |
| February | 26 February 1989 | Turin | 972.1 | [203] | CRU EMULATE Milan 26 Feb 1989 978.54 | |
| March | 19 March 1797 | Turin | 976.9 | [203] | *975.2 hPa il 5 Marzo 2009-http://www.mirandolameteo.it/recordstorici.html | CRU EMULATE Milan 28 March 1864 985 |
| October | 20 October 20 1825 | Turin | 979.7 | [203] | CRU EMULATE 28 Oct 1959 Milan 984.47 | |
| December | 2 December 1976, | Turin | 971.7 | [203] | CRU Emulate Milan 2 Dec 1976 977.1 |
Italy list of atmospheric pressure below 980 hPa (incomplete)[edit]
Pressure below 980 hPa recorded only 7 times in Italy peninsular from the late eighteenth century to the present (always in central north).[203] Never less than 970 hPa.[208]
- 19 March 1797, Turin 976.9 hPa
- 20 October 1825, Turin 979.7 hPa
- 23 February 1879, Turin 979.3 hPa
- 23 January 1897, Turin 978.0 hPa
- 2 December 1976 Turin 971.7 hPa
- 26 February 1989 Turin 972.1 hPa
to which can be added
- 5 March 2009, it's down to 978 hPa (provisional value not yet validated, and referred to the area of Turin Caselle).
Pressione atmosferica piu' bassa: 975.2 hPa il 5 Marzo 2009-http://www.mirandolameteo.it/recordstorici.html
- December 1999 Cavallino Treporti, Veneto 976.5 hPa.[209]
- March 2006 Cavallino Treporti, Veneto 976 hPa.[209]
- 30 January 2015 Asiago and Malo, Veneto 974 hPa.[209]
investigate 29 January 2015 968hPa
Iberia[edit]
>1050 along north coast of Spain in January 1905 31.0 inches of mercury (1,050 hPa).[210]
Spain[edit]

- A provisional highest atmospheric pressure: 9 January 2015 Castile and León ~1050 hPa.[211][212] Benavente, Zamora reached 1050.6 hPa breaking the previous record from 10 December 1980 at L'Estartit north eastern Spain at 1045 hPa.[213]
1905 DWR additions 30 January Corunna 30.92 inches of mercury (1,047 hPa).https://digital.nmla.metoffice.gov.uk/IO_04af3c6b-d669-465f-b7f5-e701579a24f2/
On 29 January 1905 Instituto Central Meteorológico report in Santander an evening reading of 788.5 millimetres of mercury (1,051.2 hPa).[214]
Balearic islands[edit]
- Highest air pressure: 9 January 2015, Ibiza Airport 1041.1 hPa.[216] The 9 January 2015 air pressure was 0.3 hPa more than the previous record from January 1983.[216]
Gibraltar[edit]
From CRU Emulate dataset 1850-2002 1903 feb 21 1038.68 hPa, 1983 jan 26 1038.47 hPa (1039.6 https://weatherspark.com/h/d/147711/1983/1/26/Historical-Weather-on-Wednesday-January-26-1983-at-Gibraltar-International-Airport-Gibraltar#Figures-Pressure 9 January 2015 30.775 inhg ~1042 hPa https://weatherspark.com/h/d/147711/2015/1/9/Historical-Weather-on-Friday-January-9-2015-at-Gibraltar-International-Airport-Gibraltar#Figures-Pressure),
1851 June 2 986.74 hPa.
- 8 Nov 2014 29.09 inches of mercury (985 hPa).https://weatherspark.com/h/d/147711/2014/11/28/Historical-Weather-on-Friday-November-28-2014-at-Gibraltar-International-Airport-Gibraltar#Figures-Pressure
- 7 March 1991 29.09 inches of mercury (985 hPa).https://weatherspark.com/h/d/147711/1991/3/7/Historical-Weather-on-Thursday-March-7-1991-at-Gibraltar-International-Airport-Gibraltar#Figures-Pressure
10 February 1979 28.94 inches of mercury (980 hPa).https://weatherspark.com/h/d/147711/1979/2/10/Historical-Weather-on-Saturday-February-10-1979-at-Gibraltar-International-Airport-Gibraltar#Figures-Pressure
Portugal[edit]
- Highest air pressure: 9 January 2015 Chaves and Bragança, Portugal 1050.3 hPa.[217][218] The first time values over 1050 hPa had been recorded in continental Portugal.[219]
- A low air pressure: 15 February 1941 Évora 931 hPa is reported by one source, which also reports a minimum value of 937 hPa in Coimbra and 950 hPa in Lisbon during the passage of this low pressure.[220] Other sources only give minimum values of around 950 hPa in Lisbon as the minimum during the passage of this low.[221][222]
Coimbra !?937 hPa.http://www.meteopt.com/forum/topico/severa-tempestade-de-15-fevereiro-1941-em-portugal.793/[better source needed]
Braganca values of 1046.1 hPa, recorded on January 6, 2005 and 1045.4 recorded in February 1989 were the highest values of atmospheric pressure https://www.gpp.pt/images/Agricultura/Seca/meteo_jan2015.pdf
Malta[edit]
1961 to 1990 The highest value of 1,029.1 hPa was reached during January.[223]
9 January 2015 >1035 hPa according to KNMI analysis chart -http://www.knmi.nl/nederland-nu/klimatologie/daggegevens/weerkaarten 2004-present 9 Jan 2015 30.62 inches of mercury (1,037 hPa)https://weatherspark.com/h/d/148306/2015/1/9/Historical-Weather-on-Friday-January-9-2015-at-Malta-International-Airport-Malta#Figures-Pressure
31 December 2006 and 1 January 2007 30.71 inches of mercury (1,040 hPa)https://weatherspark.com/h/d/148306/2006/12/31/Historical-Weather-on-Sunday-December-31-2006-at-Malta-International-Airport-Malta#Figures-Pressure
- 7 Nov 2014 Malta international Airport 29.06 inches of mercury (984 hPa) https://weatherspark.com/h/d/148306/2014/11/7/Historical-Weather-on-Friday-November-7-2014-at-Malta-International-Airport-Malta#Figures-Pressure
- {{convert29.12
Emulate 1869 3 23 989.91
25 January 1907 8 am morning reading only Malta 777.4 millimetres of mercury (1,036.4 hPa).https://library.noaa.gov/Collections/Digital-Docs/Foreign-Climate-Data/Egypt-Climate-Data#o44513570
Greece[edit]
- A high pressure: 24 January 1907 Athens 8 am daily morning reading 787.7 millimetres of mercury (1,050.2 hPa).[224]
https://library.noaa.gov/Collections/Digital-Docs/Foreign-Climate-Data/Egypt-Climate-Data#o44513570
Cyprus[edit]
24 and 25 January 1907 Limassol 8 am morning readings only 774.2 millimetres of mercury (1,032.2 hPa).https://library.noaa.gov/Collections/Digital-Docs/Foreign-Climate-Data/Egypt-Climate-Data#o44513570
Notable North Atlantic non-tropical pressures[edit]
- https://trj.blog.is/blog/trj/entry/2209510/ Jan 7 1952, Jan 15 1933, feb 8 1925
- ✔ ERICA IOP-4 5 January 1989 60W 40N 938 hPa http://journals.ametsoc.org/doi/pdf/10.1175/1520-0493%281993%29121%3C2452%3ASOOEIM%3E2.0.CO%3B2
- Kurt (pre lothar)
- ✔ 1989 29 October 926 hPa http://www.wetterzentrale.de/maps/archive/1989/cfsr/CFSR_1_1989102918_1.png https://twitter.com/WorldClimateSvc/status/1050814054367932418
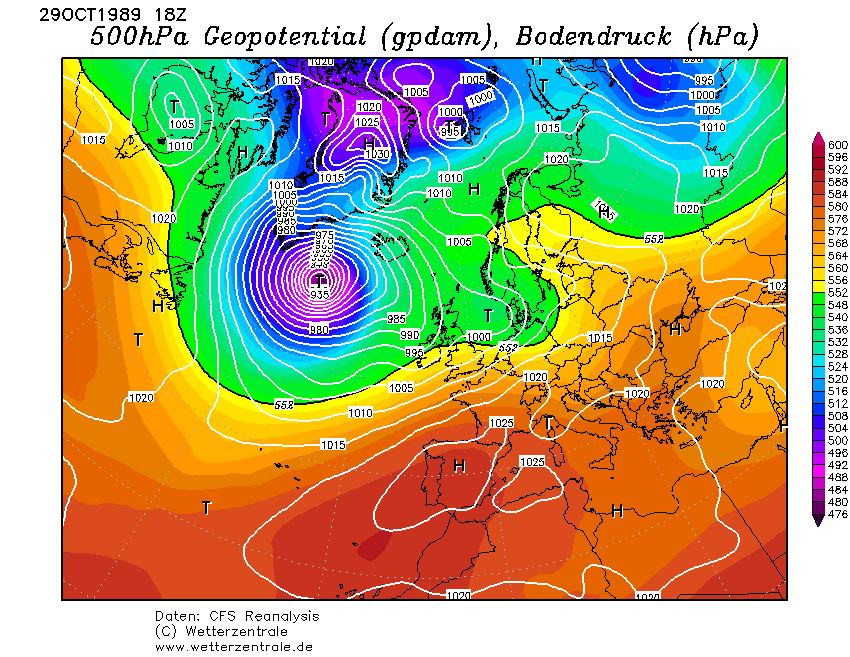
- 1990 January - (8 January 939 mb) MWLhttps://babel.hathitrust.org/cgi/pt?id=uiug.30112104094245;view=1up;seq=53 In January 1990, for example, an extreme storm hit the south coast of Iceland. At its peak intensity, the atmospheric pressure plunged to 928 millibars at a location 200 km southwest of the country.[225]
- 10 February 2011 "Paolini" 935 hPa http://www.met.fu-berlin.de/wetterpate/Lebensgeschichten/Tief_PAOLINI_11_02_11.htm http://www.met.fu-berlin.de/de/wetter/maps/Prognose_20110211.gif .24 HOUR FORECAST LOW E OF AREA NEAR 56N32W 928 MB. OVER https://www.americanwx.com/bb/topic/13167-intense-natl-low/ 935http://www.vos.noaa.gov/MWL/dec_11/MWL_1211.pdf
Anne951 hPa MWL http://www.vos.noaa.gov/MWL/201408/northatlantic.shtml
- 7 January 2015 SW of Greenland low named "Christian" by FUB 936 hPa.[226]http://www.met.fu-berlin.de/de/wetter/maps/Analyse_20150107.gif 940 FUBhttp://www.met.fu-berlin.de/wetterpate/Lebensgeschichten/Tief_CHRISTIAN_05_01_15.htm
Rachel/Hermann14-15 January 2015 http://www.eumetsat.int/website/home/Images/ImageLibrary/DAT_2520477.html see lacunae/22 943 hPa
- 20 December 2016 in region of Jan Mayen low named "Zarina" by FUB 937 hPa.-http://trj.blog.is/blog/trj/entry/2187023/ (technically Arctic Ocean) UK Met office 00utc 21 December chart also 937. MWL 940 hPa 70N 13W at 0000 UTC on
the 21 December.[227]
- 25 feb 2017 https://twitter.com/NWSOPC/status/835243314790207489 UDO (FUB) 939 NWS OPC 25 feb,-https://twitter.com/NWSOPC/status/835243314790207489 https://twitter.com/NWSOPC/status/835512308877127680 lowest on Met Office charts, 940 isobar FUB 25 feb
http://oceanweatherservices.com/blog/2017/02/23/938mb-hurricane-force-storm-forecast-off-greenland/
- 21 October 2017 938 hPa Met Office surface chart for 22 october 0000UTC. FUB "Florenz" http://trj.blog.is/blog/trj/entry/2204816/
- 15 January 2018 Evi 940 hPa-https://twitter.com/Meteorologene/status/951870709608960006
935 1800 UTC 14 Jan 2018 UKMO Analysis http://www1.wetter3.de/Archiv/UKMet/18011418_UKMet_Analyse.gif, 940 FUB http://www.met.fu-berlin.de/de/wetter/maps/Analyse_20180115.gif , 950 dwd tdt https://www.dwd.de/DE/wetter/thema_des_tages/2018/1/14.html Trausti 934 https://twitter.com/hungurdiskar/status/952559367584387074
- 8 January 2020 Bianca DWD just below 940, UKMO analysis nadir over arctic .http://www1.wetter3.de/Archiv/UKMet/20010806_UKMet_Analyse.gif https://www.dwd.de/DE/wetter/thema_des_tages/2020/1/7.html
https://trj.blog.is/blog/trj/entry/2244563/
- 10-11 January 2020 Elisa ukmo chart 943
- 13 Jan Brendan 939 https://www.bbc.co.uk/news/uk-wales-51174008
- ✔7 February Ruth 935 FUB, 928 gfs, nws opc 930 https://twitter.com/NWSOPC/status/1225917997610500097
- ✔14 February 2020 Uta 933
- 15 February 20202 Victoria (Dennis) https://twitter.com/SimonLeeWx/status/1228771725954965510
Long-term trends[edit]
10.1038/news030317-6

long term analysis by Stephen Burt [229]
appears to be a correlation between record high and low (1907), which could be...
http://www.nature.com/nature/journal/v522/n7557/full/nature14550.html
Decline in Siberian High intensity is observed in tandem with the positive mode of the Arctic oscillation.[230] Spatial correlation analyses indicate that enhanced cyclogenetic conditions over the eastern flank of the Icelandic Low are associated with a milder Siberian High.[230] http://www.theweatheroutlook.com/twoother/latest.aspx?type=buzz&id=3426&title=Winters+have+got+milder
Recent[edit]
more recently high pressure 13 March 2015 above 1050.[231]
Luisa, 15 March 2015 highest air pressure value for 20 years in Sweden, 1049.8 hPa max in Sweden at Vilhelmina Airport.[93] The Finnish station Lappeenranta Hiekkapakka recorded 1055.1 hPa 10 o'clock 16 March. I och för sig rapporterades hela 1055,8 hPa från norska Finsevatn Finsevatnet under söndagsmorgonen, men eftersom den stationen ligger 1 210 meter över havet så blir det alltid en viss osäkerhet när man försöker korrigera lufttrycket att motsvara havets nivå.[93] >1050 centred over Lake Ladoga 16 march Cite error: A <ref> tag is missing the closing </ref> (see the help page).
cooper/dieter >1050 swe fin ru ee dk no lv-http://www.met.fu-berlin.de/de/wetter/maps/Analyse_20120208.gif
Notes[edit]
The unit of pressure in the International System (SI) is the Newton per metre squared (Nm-2) to which has been given the name Pascal and the symbol Pa. The unit for measuring atmospheric pressure for international meteorological purposes, however, remains the millibar (mb).1 mb = 100 Pa = 1 hPa = 33.864 inches[27]
See also[edit]
Climate_of_the_United_Kingdom -remove duplication of pressure under winds section. United_Kingdom_weather_records List_of_weather_records -make other Barometric/Atmospheric pressure -see also to list of this page
External links[edit]
- Climatic Research Unit corrected MSLP data for Emulate
- !TEMP! location facit
- http://docs.lib.noaa.gov/rescue/data_rescue_germany.html#top
- http://eca.knmi.nl/
References[edit]
- ^ a b McWilliams, Brendan (17 December 2001). "Paradox of high pressure in cold places". Irish Times. Retrieved 2 October 2016.
- ^ Hanna, Edward; Cappelen, John; Allan, Rob; Jónsson, Trausti; Le Blancq, Frank; Lillington, Tim; Hickey, Kieran (December 2008). "New Insights into North European and North Atlantic Surface Pressure Variability, Storminess, and Related Climatic Change since 1830". Journal of Climate. 21 (24): 6739–6766. doi:10.1175/2008JCLI2296.1. Retrieved 5 May 2016.
- ^ "Une pression atmosphérique record ? - MétéoSuisse". www.meteosuisse.admin.ch (in French). 28 December 2016. Retrieved 22 September 2018.
- ^ a b c d e f g h i j Burt, Stephen (February 2007). "The Highest of the Highs … Extremes of barometric pressure in the British Isles, Part 2 – the most intense anticyclones". Weather. 62 (2): 31–41. Bibcode:2007Wthr...62...31B. doi:10.1002/wea.35. S2CID 120627168. Retrieved 31 May 2015.
- ^ "Nytt svenskt rekord för högsta lufttryck i oktober" (in Swedish). SMHI. 4 October 2016. Retrieved 7 October 2016.
- ^ Cite error: The named reference
burt2007bwas invoked but never defined (see the help page). - ^ Namias, J. (October 1987). "Factors Relating to the Explosive North Atlantic Cyclone of December 1986". Weather. 42 (10): 322–325. Bibcode:1987Wthr...42..322N. doi:10.1002/j.1477-8696.1987.tb04860.x.
- ^ Sanders, Frederick; Gyakum, John R. (1980). "Synoptic-Dynamic Climatology of the "Bomb"". Monthly Weather Review. 108 (10): 1589–1606. Bibcode:1980MWRv..108.1589S. doi:10.1175/1520-0493(1980)108<1589:SDCOT>2.0.CO;2. Retrieved 21 March 2013.
- ^ "Causas de un anticiclón de récords: un apunte sinóptico". Tiempo. 10 January 2015. Retrieved 25 June 2015.
- ^ Sistek, Scott (30 December 2014). "Seattle sets all-time record high atmospheric pressure Tuesday". Komo News. Retrieved 19 October 2015.
- ^ Burt, Stephen (March 2014). "Britain's lowest barometric pressure since 1886". Weather. 69 (3): 79–81. Bibcode:2014Wthr...69...79B. doi:10.1002/wea.2285. S2CID 120684722. Retrieved 31 May 2015.
- ^ Cite error: The named reference
BurtAKwas invoked but never defined (see the help page). - ^ Schönwiese, Christian-D.; Rapp, Jörg (1997). Climate trend atlas of Europe : based on observations 1891-1990. Dordrecht [u.a.]: Kluwer. ISBN 978-0792344834. Retrieved 24 October 2015.
- ^ Hanna, Edward; Jónsson, Trausti; Box, Jason E. (August 2004). "An analysis of Icelandic climate since the nineteenth century". International Journal of Climatology. 24 (10): 1193–1210. Bibcode:2004IJCli..24.1193H. doi:10.1002/joc.1051. S2CID 38731339. Retrieved 9 June 2015.
- ^ Gray, Lesley J.; Scaife, Adam A.; Mitchell, Daniel M.; Osprey, Scott; Ineson, Sarah; Hardiman, Steven; Butchart, Neal; Knight, Jeff; Sutton, Rowan; Kodera, Kunihiko (27 December 2013). "A lagged response to the 11 year solar cycle in observed winter Atlantic/European weather patterns". Journal of Geophysical Research: Atmospheres. 118 (24): 13, 405–13, 420. doi:10.1002/2013JD020062. S2CID 29043124.
- ^ Gray, L. J.; Woollings, T. J.; Andrews, M.; Knight, J. (July 2016). "Eleven-year solar cycle signal in the NAO and Atlantic/European blocking". Quarterly Journal of the Royal Meteorological Society. 142 (698): 1890–1903. doi:10.1002/qj.2782. S2CID 125044568.
- ^ Burt, Christopher C. (26 November 2011). "World and U.S. Anti-cyclonic (High Barometric) Pressure Records". Weather Underground. Retrieved 8 August 2015.
- ^ "Word Weather /Climate Extremes Archive". World Meteorological Organization, Arizona State University. Retrieved 8 August 2015.
- ^ a b "World: Highest Sea Level Air Pressure Below 750 meters". Arizona State University. Retrieved 7 October 2012.
- ^ a b "World: Highest Sea Level Air Pressure Above 750 meters". Arizona State University. Retrieved 7 October 2012.
- ^ Kramer, MR; Springer C; Berkman N; Glazer M; Bublil M; Bar-Yishay E; Godfrey S (March 1998). "Rehabilitation of hypoxemic patients with COPD at low altitude at the Dead Sea, the lowest place on earth" (PDF). Chest. 113 (3): 571–575. doi:10.1378/chest.113.3.571. PMID 9515826.
PMID 9515826
{{cite journal}}: External link in|quote= - ^ Jeff Masters (November 15, 2013). "Haiyan's True Intensity and Death Toll Still Unknown". Weather Underground. Retrieved November 16, 2013.
- ^ Chris Landsea (2010-04-21). "Subject: E1), Which is the most intense tropical cyclone on record?". Atlantic Oceanographic and Meteorological Laboratory. Archived from the original on 6 December 2010. Retrieved 2010-11-23.
- ^ Lee, Julian J. (October 2004). "Pressure Measurements at the ground in an F-4 tornado". Preprints of the 22nd Conference on Severe Local Storms. Hyannis, Massachusetts: American Meteorological Society.
{{cite conference}}: Unknown parameter|coauthors=ignored (|author=suggested) (help) - ^ An included reference.
- ^ a b Cite error: The named reference
Shieldswas invoked but never defined (see the help page). - ^ a b c "National Meteorological Library and ArchiveFact sheet 9 — Weather extremes" (PDF). Mat Office. Retrieved 31 May 2015.
- ^ a b c d e f g h "UKWeatherWorld forum:UK High & Low Pressure Records by Month". UKWeatherWorld. UKWeatherworld. Retrieved 24 June 2015.
- ^ a b "UK: Highest June MSLP". exmetman. 8 June 2015. Retrieved 1 August 2015.
- ^ Burt, Stephen (1 July 2006). "Britain's highest barometric pressure on record is incorrect". Weather. 61 (7): 210–211. Bibcode:2006Wthr...61..210B. doi:10.1256/wea.40.06. S2CID 119485783. Retrieved 7 June 2015.
- ^ Brugge, Roger (unknown). "Maidenhead (Berkshire, UK): Old weather news". Brugge. Retrieved 7 June 2015.
{{cite news}}: Check date values in:|date=(help) - ^ Hewson, Tim (2001). "The North Sea storm of 30 October 2000". Weather. 56 (3): 115–116. doi:10.1002/j.1477-8696.2001.tb06547.x. S2CID 119744773.
- ^ "Storm caused by most intense low to cross UK in September in 30 years". Met Office Blog. 26 September 2012. Retrieved 5 June 2015.
- ^ a b c "February 1884". Symons's Monthly Meteorological Magazine. February 1884. Retrieved 6 September 2015.
- ^ "High Pressure: How high is high?". ITV News. 3 January 2019. Retrieved 1 September 2019.
- ^ a b c d e http://artikkel.yr.no/tidenes-trykk-1.12165870 Yr.no - Tidenes trykk
- ^ Pedersen, Kamilla (3 February 2012). "Rekordhøyt trykk i Europa" (in Norwegian). yr.no. Retrieved 10 November 2015.
- ^ a b Pedersen, Kamilla (3 February 2012). "Rekordhøyt trykk i Europa". NRK (in Norwegian). Yr.no. Retrieved 30 August 2017.
- ^ @Meteorologene (3 May 2017). "Ny mai-rekord for høytrykk i #Trondheim idag! 1039,6 hPa sammenlignet med forrige rekord på 1037,0 fra 7.5.2006" (Tweet) – via Twitter.
- ^ Husby Sandnes, Ådne (4 October 2016). "Ny høytrykksrekord: - Jeg har aldri sett noe lignende på høsten før" (in Norwegian). Dagbladet. Retrieved 4 October 2016.
- ^ Rommertveit, Astrid (6 October 2016). "Superhøytrykket fortsetter i neste uke". NRK (in Norwegian). Yr.no. Retrieved 6 October 2016.
- ^ Toppe, Ronald (5 October 2016). "Her kan det bli 20 grader" (in Norwegian). TV 2. Retrieved 6 October 2016.
- ^ institutt, NRK og Meteorologisk. "Detailed weather statistics for Otta observation site". yr.no.
- ^ Pike, W. S. (1990). "Persistent coastal convergence in a heavy snowfall event on the south-east coast of England". Meteorological Magazine. 119.
- ^ Lie, Bernt (26 January 2015). "Vær og Vind - YR.NO-LUFTTRYKK: - Vær og vind korrigerer Norges laveste og høyeste lufttrykk - Powered by Proweb". www.verogvind.net. Retrieved 11 June 2016.
- ^ "Sjekk værrekordene der du bor". NRK (in Norwegian). Yr.no. 1 December 2016. Retrieved 4 December 2016.
Norgesrekord: Laveste lufttrykk: 935.9hPa Målested: Bergen - Lungegårdshospitalet i Bergen, Hordaland Måletidspunkt: 27.01.1884
- ^ "Venter historisk lavtrykk". VG. 22 December 2004. Retrieved 11 June 2016.
- ^ "Høytrykkrekord feirer 101 år - met.no". met.no. met.no. 23 January 2008. Retrieved 11 June 2016.
- ^ "Stasjon Mike Meteorologie" (in Norwegian). Geophysics Institute University of Bergen. Archived from the original on 5 August 2016. Retrieved 11 June 2016.
- ^ a b Lie, Bernt (10 February 2020). "EKSTREMVÆRET ELSA MED REKORDLAVT LUFTTRYKK PÅ HELGELAND: - Har ikke vært lavere lufttrykk i Norge i februar siden 1907 - Powered by Proweb". www.verogvind.net (in Norwegian). Vær og Vind.
- ^ "Rekordhøyt lufttrykk | Bjørnøya Meteorologiske Stasjon". bjornoya.org (in Norwegian Bokmål). Retrieved 1 October 2017.
- ^ "Vejrekstremer i Danmark" (in Danish). Danish Meteorological Institute. 6 January 2015. Retrieved 13 June 2015.
- ^ Hogsholt, Danny (3 January 2013). "Lufttrykket kan blive det laveste i 5 år" (in Danish). TV2. Retrieved 10 June 2015.
- ^ Rasmussen, Michella (7 February 2014). "Scandinavia vejrrekorder". Retrieved 10 November 2015.
- ^ Christian, Lietzen (29 September 2015). "Europamestre i højtryk" (in Danish). DMI. Retrieved 29 September 2015.
- ^ Hogsholt, Danny (29 September 2015). "Tårnhøjt lufttryk over Danmark slår rekord" (in Danish). TV2. Retrieved 30 September 2015.
- ^ a b c "DANISH METEOROLOGICAL INSTITUTE MINISTRY OF TRANSPORT TECHNICAL REPORT PDF". Docplayer.dk. ISSN 1399-1388.
- ^ Brandt, Anders (7 February 2012). "Højeste lufttryk i Danmark i 27 år" (in Danish). TV2. Retrieved 10 June 2015.
- ^ Christian, Lietzen (29 September 2015). "Europamestre i højtryk" (in Danish). DMI. Retrieved 29 September 2015.
- ^ Hogsholt, Danny (29 September 2015). "Tårnhøjt lufttryk over Danmark slår rekord" (in Danish). TV2. Retrieved 30 September 2015.
- ^ "Trykket stiger - 139 år gammel vejrrekord falder i nat: DMI". www.dmi.dk (in Danish). DMI. 4 October 2016.
- ^ "Vejret arbejdede på højtryk i nat - og slog 139 år gammel rekord" (in Danish). TV2. 5 October 2016. Retrieved 5 October 2016.
- ^ Brandt, Anders (5 January 2012). "Laveste lufttryk over Danmark i fem år". TV2. Retrieved 10 November 2015.
- ^ Brandt, Anders (7 February 2012). "Højeste lufttryk i Danmark i 27 år" (in Danish). TV2. Retrieved 10 June 2015.
- ^ Brandt, Anders (7 February 2012). "Højeste lufttryk i Danmark i 27 år" (in Danish). TV2. Retrieved 30 September 2015.
- ^ a b "Lufttryck" (in Swedish). SMHI. 23 April 2014. Retrieved 6 June 2015.
- ^ a b "Svenska lufttrycksrekord" (in Swedish). SMHI. 23 April 2014. Retrieved 6 June 2015.
- ^ "Högsta uppmätta lufttryck i Sverige i januari" (in Swedish). SMHI. 23 April 2014. Retrieved 9 July 2015.
- ^ "Högsta uppmätta lufttryck i Sverige i februari" (in Swedish). SMHI. 23 April 2014. Retrieved 9 July 2015.
- ^ "Högsta uppmätta lufttryck i Sverige i mars" (in Swedish). SMHI. 23 April 2014. Retrieved 9 July 2015.
- ^ "Högsta uppmätta lufttryck i Sverige i april" (in Swedish). SMHI. 23 April 2014. Retrieved 9 July 2015.
- ^ "Högsta uppmätta lufttryck i Sverige i maj" (in Swedish). SMHI. 23 April 2014. Retrieved 9 July 2015.
- ^ "Högsta uppmätta lufttryck i Sverige i juni" (in Swedish). SMHI. 23 April 2014. Retrieved 9 July 2015.
- ^ "Högsta uppmätta lufttryck i Sverige i juli" (in Swedish). SMHI. 23 April 2014. Retrieved 9 July 2015.
- ^ "Högsta uppmätta lufttryck i Sverige i augusti" (in Swedish). SMHI. 23 April 2014. Retrieved 9 July 2015.
- ^ "Högsta uppmätta lufttryck i Sverige i september" (in Swedish). SMHI. 23 April 2014. Retrieved 9 July 2015.
- ^ Lundgren, Misha (29 September 2015). "Ett mer än hundraårigt septemberrekord slaget" (in Swedish). SMHI. Retrieved 29 September 2015.
- ^ "Högsta uppmätta lufttryck i Sverige i oktober" (in Swedish). SMHI. 23 April 2014. Retrieved 9 July 2015.
- ^ "Högsta uppmätta lufttryck i Sverige i november" (in Swedish). SMHI. 23 April 2014. Retrieved 9 July 2015.
- ^ "Högsta uppmätta lufttryck i Sverige i december" (in Swedish). SMHI. 23 April 2014. Retrieved 9 July 2015.
- ^ "Lägsta uppmätta lufttryck i Sverige i januari" (in Swedish). SMHI. 23 April 2014. Retrieved 9 July 2015.
- ^ "Lägsta uppmätta lufttryck i Sverige i februari" (in Swedish). SMHI. 23 April 2014. Retrieved 9 July 2015.
- ^ "Lägsta uppmätta lufttryck i Sverige i mars" (in Swedish). SMHI. 23 April 2014. Retrieved 9 July 2015.
- ^ "Lägsta uppmätta lufttryck i Sverige i april" (in Swedish). SMHI. 23 April 2014. Retrieved 9 July 2015.
- ^ "Lägsta uppmätta lufttryck i Sverige i maj" (in Swedish). SMHI. 23 April 2014. Retrieved 9 July 2015.
- ^ "Lägsta uppmätta lufttryck i Sverige i juni" (in Swedish). SMHI. 23 April 2014. Retrieved 9 July 2015.
- ^ "Lägsta uppmätta lufttryck i Sverige i juli" (in Swedish). SMHI. 23 April 2014. Retrieved 9 July 2015.
- ^ "Lägsta uppmätta lufttryck i Sverige i augusti" (in Swedish). SMHI. 23 April 2014. Retrieved 9 July 2015.
- ^ "Lägsta uppmätta lufttryck i Sverige i september" (in Swedish). SMHI. 23 April 2014. Retrieved 9 July 2015.
- ^ "Lägsta uppmätta lufttryck i Sverige i oktober" (in Swedish). SMHI. 23 April 2014. Retrieved 9 July 2015.
- ^ "Lägsta uppmätta lufttryck i Sverige i november" (in Swedish). SMHI. 23 April 2014. Retrieved 9 July 2015.
- ^ a b "Lägsta uppmätta lufttryck i Sverige i december" (in Swedish). SMHI. 23 April 2014. Retrieved 9 July 2015.
- ^ a b c d Hellström, Sverker (17 March 2015). "Högsta lufttrycket i mars månad på nästan 20 år" (in Swedish). SMHI. Retrieved 8 June 2015.
- ^ a b Burt, Stephen (June 2008). "Intense anticyclone over north-west Russia, early January 2008". Weather. 63 (6): 174–176. Bibcode:2008Wthr...63..174B. doi:10.1002/wea.220. S2CID 122350841. Retrieved 26 June 2015.
- ^ Burt, S. D. (1983). "New Uk 20Th Century Low Pressure Extreme". Weather. 38 (7): 209–213. doi:10.1002/j.1477-8696.1983.tb03700.x.
- ^ a b "Högsta uppmätta lufttryck i Sverige i januari" (in Swedish). SMHI. 23 April 2014. Retrieved 8 July 2015.
- ^ a b Ilmatieteen laitos http://ilmatieteenlaitos.fi/saaennatyksia
- ^ a b c Burt, Christopher C. (20 November 2011). "World and U.S. Lowest Barometric Pressure Records". Weather Underground. Retrieved 11 June 2015.
- ^ "Höga lufttryck- svenskt februarirekord | SMHI". www.smhi.se (in Swedish). 1 February 2012. Retrieved 1 October 2017.
- ^ "Download observations - Finnish Meteorological Institute". en.ilmatieteenlaitos.fi. Retrieved 10 July 2020.
- ^ a b c Müller, Mandy (24 January 2008). "Lebensgeschichte: Hochdruckgebiet EVI" (in German). Free University of Berlin. Retrieved 18 July 2015.
- ^ "Air Pressure". Estonian Weather Service. 11 June 2015. Retrieved 11 June 2015.
- ^ "20th Century Reanalysis of NOAA, 23 January 1907". wetterzentrale. Retrieved 11 June 2015.
- ^ "Jaanuari ekstreemumid". ilm.pri.ee (in Estonian). Retrieved 16 September 2020.
- ^ "Veebruari ekstreemumid". ilm.pri.ee (in Estonian). Retrieved 16 September 2020.
- ^ a b "Märtsi ekstreemumid". ilm.pri.ee (in Estonian). Retrieved 17 September 2020.
- ^ a b "Aprilli ekstreemumid". ilm.pri.ee (in Estonian). Retrieved 17 September 2020.
- ^ a b "Mai ekstreemumid". ilm.pri.ee (in Estonian). Retrieved 17 September 2020.
- ^ a b "Juuni ekstreemumid". ilm.pri.ee (in Estonian). Retrieved 17 September 2020.
- ^ a b "Juuli ekstreemumid". ilm.pri.ee (in Estonian). Retrieved 17 September 2020.
- ^ a b "Augusti ekstreemumid". ilm.pri.ee (in Estonian). Retrieved 17 September 2020.
- ^ a b "Septembri ekstreemumid". ilm.pri.ee (in Estonian). Retrieved 17 September 2020.
- ^ a b "Oktoobri ekstreemumid". ilm.pri.ee (in Estonian). Retrieved 17 September 2020.
- ^ a b "Novembri ekstreemumid". ilm.pri.ee (in Estonian). Retrieved 17 September 2020.
- ^ a b "Detsembri ekstreemumid". ilm.pri.ee (in Estonian). Retrieved 17 September 2020.
- ^ Cite error: The named reference
Jaanuarwas invoked but never defined (see the help page). - ^ Cite error: The named reference
Veebruarwas invoked but never defined (see the help page). - ^ a b c d e "Extremwetterereignisse Wetterrekorde in Mitteleuropa". Welt der Synoptik. 11 June 2015. Retrieved 11 June 2015.
- ^ a b c Cite error: The named reference
Djakowwas invoked but never defined (see the help page). - ^ Cite error: The named reference
FUBDieterwas invoked but never defined (see the help page). - ^ Andrews, James F. (1956). "The Weather and Circulation of February 1956" (PDF). Monthly Weather Review. Retrieved 27 June 2015.
- ^ Cite error: The named reference
DWR1956was invoked but never defined (see the help page). - ^ Treinzen, Matthias (29 March 2012). "Lebensgeschichte: Hochdruckgebiet DIETER" (in German). Free University Berlin. Retrieved 18 July 2015.
- ^ a b Никитин, Александр. "Синоптики Петербурга объяснили, чем вызвано аномальное атмосферное давление" (in Russian). ФБА «Экономика сегодня». Retrieved 28 September 2017.
- ^ "In Moscow, recorded the lowest atmospheric pressure". 7city.org. 11 january 2015. Retrieved 6 August 2015.
{{cite news}}: Check date values in:|date=(help) - ^ "Archangel emulate/LANDSTATION_MSLP/CORRECTED". Emulate. Climatic Research Unit. Retrieved 8 August 2015.
- ^ "Emulate, St Petersburg". Emulate. CRU. Retrieved 8 August 2015.
- ^ Burt, Stephen (June 2008). "Intense anticyclone over north-west Russia, early January 2008". Weather. 63 (6): 174–176. Bibcode:2008Wthr...63..174B. doi:10.1002/wea.220. S2CID 122350841.
- ^ "Каковы экстремальные значения атмосферного давления, зафиксированные на Земле?". www.meteovesti.ru. 29 October 2008. Retrieved 20 September 2020.
- ^ a b Паршина, Людмила (27 September 2017). "27.09.2017: Высокое атмосферное давление в Москве и Петербурге" (in Russian). www.meteoinfo.ru. Retrieved 28 September 2017.
- ^ "В Москве атмосферное давление приблизится к рекордному". Гидрометцентр России (in Russian). Retrieved 20 November 2019.
- ^ a b "Многолетние климатические данные". hmc.by (in Russian). Center of Hydrometeorology, Radioactive Contamination Control and Environmental Monitoring of the Republic of Belarus. Retrieved 23 October 2016.
- ^ a b "Многолетние климатические Февраль". hmc.by (in Russian). Center of Hydrometeorology, Radioactive Contamination Control and Environmental Monitoring of the Republic of Belarus. Retrieved 23 October 2016.
- ^ a b "Многолетние климатические Март". hmc.by (in Russian). Center of Hydrometeorology, Radioactive Contamination Control and Environmental Monitoring of the Republic of Belarus. Retrieved 23 October 2016.
- ^ a b "Многолетние климатические Апрель". hmc.by (in Russian). Center of Hydrometeorology, Radioactive Contamination Control and Environmental Monitoring of the Republic of Belarus. Retrieved 23 October 2016.
- ^ a b "Многолетние климатические Май". hmc.by (in Russian). Center of Hydrometeorology, Radioactive Contamination Control and Environmental Monitoring of the Republic of Belarus. Retrieved 23 October 2016.
- ^ a b "Многолетние климатические Июнь". hmc.by (in Russian). Center of Hydrometeorology, Radioactive Contamination Control and Environmental Monitoring of the Republic of Belarus. Retrieved 23 October 2016.
- ^ "Многолетние климатические данные" (in Russian). Republican Center for Hydrometeorology, Control of radioactive contamination and Environmental Monitoring (Hydromet). Retrieved 23 October 2016.
- ^ Cite error: The named reference
Burt2007awas invoked but never defined (see the help page). - ^ "Paramètres observés, La pression" (in France). Météo-France. Retrieved 29 June 2015.
{{cite news}}: CS1 maint: unrecognized language (link) - ^ a b "La pression atmosphérique" (in French). Météo-France. Retrieved 14 June 2015.
- ^ "Les chroniques météo de l'année 1905..." meteo-paris.com. Retrieved 29 June 2015.
- ^ "Bulletin Meteorologique de l'Algerie" (PDF). unknown. 29 January 1905. Retrieved 26 August 2015.
- ^ "Daily Weather Report". Met Office. 28 January 1905. Retrieved 9 February 2017.
{{cite journal}}: Cite journal requires|journal=(help) - ^ TOUMIT, Marie (20 January 2020). "Météo. Quatre questions sur les records de pression atmosphérique en Bretagne et en Normandie". Ouest-France.fr (in French). Retrieved 31 January 2020.
- ^ "Arrosage francilien, mistral récurrent". www.meteofrance.fr (in French). Météo-France. 13 May 2019. Retrieved 13 May 2019.
- ^ @EKMeteo (13 May 2019). "EDIT : on me glisse dans l'oreillette que la pression serait montée jusqu'à une valeur record de 1040.7 hPa à #Dunkerque au pas de temps infra-horaire (vers 10h40 locales) ! Exceptionnel pour un mois de mai. #anticyclone" (Tweet) (in French) – via Twitter.
- ^ @meteofrance (26 September 2018). "L'anticyclone responsable du beau temps actuel est exceptionnellement puissant pour la saison : ce mardi, la pression atmosphérique a atteint un niveau jamais mesuré en France au cours d'un mois de #septembre!" (Tweet) (in French) – via Twitter.
- ^ @EKMeteo (26 September 2018). "Record national mensuel de pression atmosphérique élevée hier 25-09-2018 à 9h UTC : 1040.0 hPa à Valenciennes (puis 1039.9 hPa à Lille et Le Touquet) #anticyclone Le précédent record pour un mois de septembre en France était de 1038.4 hPa à Dunkerque le 19-09-1986" (Tweet) (in French) – via Twitter.
- ^ ""L'ouragan" du 15 au 16 octobre 1987 - Tempêtes en France métropolitaine". tempetes.meteo.fr (in French). Retrieved 1 October 2020.
- ^ "Ouragan d'octobre 1987. " On n'a jamais connu plus violent en France "" (in French). Ouest-France. 15 October 2017. Retrieved 1 October 2020.
- ^ "L'ouragan d'octobre 1987 sur le nord-ouest de la France". Met Mar (138). 1988. Retrieved 15 October 2020.
- ^ "Ouragan d'octobre 1987. « On n'a jamais connu plus violent en France »" (in French). Ouest-France. 15 October 2017. Retrieved 1 October 2020.
- ^ a b c "Records". Royal Meteorological Institute. IRM. Retrieved 7 June 2015.
- ^ a b c d e f g h i "Luchtdruk - KMI". Weer KMI (in Flemish). Royal Meteorological Institute. Retrieved 17 November 2016.
- ^ "Luchtdruk" (in Dutch). KNMI. Retrieved 28 July 2015.
- ^ "De meest extreme weerrecords ter wereld en in Nederland". Retrieved 29 July 2016.
{{cite web}}:|first1=missing|last1=(help) - ^ "Weerrecords". weerrecords.fryzzle.nl. Retrieved 29 July 2016.
- ^ "Extremwetterereignisse Wetterrekorde in Westeuropa". Welt der Synoptik. 11 June 2015. Retrieved 11 June 2015.
- ^ Deutscher Wetterdienst: Wetterrekorde - Luftdruck
- ^ a b "Wetterrekorde Deutschland und Weltweit". wetterprognose-wettervorhersage.de. Retrieved 26 August 2015.
- ^ https://www.uni-frankfurt.de/45359621/Wetter.pdf. Retrieved 27 August 2017.
{{cite web}}: Missing or empty|title=(help) - ^ a b "Climate Data Center". cdc.dwd.de. Deutscher Wetterdienst. Retrieved 15 June 2020.
- ^ "Meteorologische Mittel- und Extremwerte von Berlin-Dahlem". www.met.fu-berlin.de. Retrieved 15 June 2020.
- ^ "Randtief (Sturmtief) JORIS". www.unwetterzentrale.de.
- ^ "Meteorologische Mittel- und Extremwerte von Berlin-Dahlem". www.met.fu-berlin.de. Retrieved 15 June 2020.
- ^ a b Gale, Robert L. (February 2000). "Rekordverdächtig hoher Luftdruck nächste Woche möglich – Wetterkanal vom Kachelmannwetter-Team". wetterkanal.kachelmannwetter.com. Retrieved 1 February 2020.
- ^ a b c Fabien, Ruhnau (28 December 2016). "Neue Luftdruckrekorde durch Hoch YÖRN – Wetterkanal vom Kachelmannwetter-Team". wetterkanal.kachelmannwetter.com (in German). Retrieved 1 February 2020.
- ^ "Extrem hoher Luftdruck über Mitteleuropa". Wetter.tv (in German). 21 January 2020. Retrieved 1 February 2020.
- ^ a b "Hoch EKART bricht Rekorde". WetterOnline (in German). 20 January 2020. Retrieved 1 February 2020.
- ^ "Barometer stehen auf Anschlag - Luftdruck von über 1040 hPa". WetterOnline (in German). 18 February 2015. Retrieved 1 February 2020.
- ^ a b c https://docs.google.com/viewer?url=http%3A%2F%2Fwww.met.fu-berlin.de%2F~manfred%2FDruckextreme.xls.
{{cite web}}: Missing or empty|title=(help) - ^ "Meteorologische Mittel- und Extremwerte von Berlin-Dahlem". www.met.fu-berlin.de. Retrieved 15 June 2020.
- ^ Scherhag, Richard (9 March 2013). Neue Methoden der Wetteranalyse und Wetterprognose. Springer Verlag. p. 179. ISBN 9783642492358. Retrieved 1 February 2020.
- ^ "Rund ums Wetter - Rekord-Hoch EKART über England - Auswirkungen auf Wetter und Gesundheit auch in Deutschland". Mittelrhein-Tageblatt - Das Deutsche-Tageblatt - Nachrichten und Ratgeber (in German). 20 January 2020. Retrieved 1 February 2020.
- ^ "EAH Jena misst Rekordwert beim Luftdruck | Coolis im Osten" (in German). Ernst Abbe Hochschule. 20 January 2020. Retrieved 1 February 2020.
- ^ "Hoch Yörn bringt Luftdruck wie seit Jahren nicht mehr" (in German). Der Bund. 27 December 2016. Retrieved 27 December 2016.
- ^ a b c "Schweizer Sturmforum • Thema anzeigen - Schweiz Wetter : Extreme & Rekorde". www.sturmforum.ch (in German). Retrieved 8 August 2016.
- ^ "High Pressure Dominated Middle Of January 1882". Netweather Community Forums.
- ^ "Über der Inversion mild und knochentrocken" (in German). MeteoSchweiz. 10 December 2015. Retrieved 6 August 2016.
- ^ "Hoch Yörn bringt Luftdruck wie seit Jahren nicht mehr" (in German). Der Bund. 27 December 2016. Retrieved 27 December 2016.
- ^ "Über der Inversion mild und knochentrocken" (in German). MeteoSchweiz. 10 December 2015. Retrieved 6 August 2016.
- ^ Zogg, Jürg (26 December 2016). "Hammerhoch in der Altjahrswoche". Schweizer Radio und Fernsehen (SRF) (in German). Retrieved 19 August 2017.
- ^ "Annual Bulletin on the Climate in WMO Region VI" (PDF). Retrieved 5 September 2016.
- ^ "Klimabulletin April 2015" (PDF). MeteoSchweiz. 8 May 2015. Retrieved 5 September 2016.
- ^ "Bulletin climatologique septembre 2018" (PDF). MétéoSuisse. 10 October 2018. Retrieved 27 December 2018.
- ^ Sütterlin, Cédric (29 December 2016). "MeteoNews: Dezember 2016: Ein Monat voller Rekorden! (29. Dezember 2016)" (in German). meteonews.ch. Retrieved 7 February 2017.
- ^ Walt, Tobias (28 December 2016). "MeteoNews: Rekordhoch Yörn beschert uns extremen Luftdruck! (28. Dezember 2016)" (in German). meteonews.ch. Retrieved 7 February 2017.
- ^ "Rekordhoher Luftdruck!". Vaterland online (in German). Retrieved 7 February 2017.
- ^ a b c Deutsche Seewarte (24 January 1907), Wetterbericht von Deutsche Seewarte (in German), vol. 1907, Hamburg, retrieved 17 February 2020
{{citation}}: CS1 maint: location missing publisher (link) - ^ "BARDZO NISKIE CIŚNIENIE W ZAKOPANEM - Rekord Polski Pobity!" (in Polish). tatromaniak.pl/. 30 January 2015. Retrieved 26 August 2015.
- ^ "Michaś przyniósł najniższe ciśnienie nawet od 26 lat" (in Polish). twojapogoda.pl. 31 January 2015. Retrieved 26 August 2015.
- ^ a b "Archiv počasí, klima České republiky | In-počasí". www.in-pocasi.cz (in Czech). Retrieved 7 August 2016.
- ^ "Il forum di MeteoLive". meteolive.leonardo.it (in Italian). Retrieved 11 December 2016.
- ^ "V pátek bude rekordně nízký tlak, kardiaci si musejí dát pozor" (in Czech). idnes.cz. 29 January 2015. Retrieved 25 August 2015.
- ^ (in Slovakian). Slovak Hydrometeorological Institute. 21 January 2020 https://www.facebook.com/shmu.sk/posts/3509080305832184. Retrieved 26 January 2020.
{{cite news}}: Missing or empty|title=(help)CS1 maint: unrecognized language (link) - ^ a b "Éghajlat PAGE". owww.met.hu (in Hungarian). Országos Meteorológiai Szolgálat. Retrieved 5 August 2016.
- ^ @meteoSI (21 January 2020). "Pri nas so bile vrednosti okrog 1048 hPa. Še malo višje vrednosti so bile izmerjene 24. 12. 1963 in 24. 1. 1907" (Tweet) (in Slovenian) – via Twitter.
- ^ "Vremenske napovedi 2015". www.slovreme.net. Retrieved 11 August 2016.
- ^ "meteo.si - Uradna vremenska napoved za Slovenijo - Državna meteorološka služba RS - Novice / Zanimivosti". meteo.arso.gov.si. 29 January 2015. Retrieved 11 August 2016.
- ^ POPADIĆ, RADE (21 January 2020). "Ekstremne-Vrijednosti velikom dijelu zemlje upravo se bilježi najviši tlak zraka u znanoj povijesti: Moguća izražena oseka | DALMACIJA DANAS - obala, otoci, Zagora. Najnovije vijesti iz Dalmacije" (in Croatian). Dalmacija Danas. Retrieved 21 January 2020.
- ^ "Ovako što se ne pamti! Fenomen zapanjio Vakulu: Što će tek biti do ponoći..." Net.hr (in Croatian). 21 January 2020. Retrieved 21 January 2020.
- ^ a b c d e f g Rossi, Marco (6 March 2009). "Record di pressione a confronto: 5 marzo 2009 nella "top five" dell'ultimo secolo" (in Italian). Meteogiornale. Retrieved 13 June 2015.
- ^ "Vortice Polare prossimo all'Italia: pressione atmosferica di tempesta. Picco da record - Ricerca meteo su clima rigido | FREDDOFILI.IT". www.freddofili.it. 28 January 2015. Archived from the original on 2016-09-09. Retrieved 2 December 2017.
- ^ Raso, Beatrice (21 January 2020). "Meteo, ancora alti valori di pressione sull'Italia: l'Anticiclone porta Bolzano a 1045hPa, 1048hPa a Concordia Sagittaria [DATI]". Meteo Web (in Italian). Retrieved 26 January 2020.
- ^ "anticiclone eccezionale anche in ITALIA: toccati valori di 1048 hPa tra Veneto e Friuli". Meteo Reporter24 (in Italian). 21 January 2020. Retrieved 26 January 2020.
- ^ "Ungewöhnlich hoher Luftdruck über Südtirol". Südtirol News (in German). 21 January 2020. Retrieved 26 January 2020.
- ^ Meloni, Andrea (29 January 2015). "Italia, sarà record: è in formazione una Bassa Pressione mai misurata prima" (in Italian). Meteogiornale. Retrieved 13 June 2015.
- ^ a b c "Meteo e Clima. Particolare situazione di bassa pressione sul Veneto" (PDF) (in Italian). Agenzia Regionale per la Prevenzione e Protezione Ambientale del Veneto. 10 February 2015. Retrieved 14 May 2020.
- ^ Fox, W. L. (1905). "The High Barometer of January 1905 at Falmouth". Symons's Meteorological Magazine. 40: 6. Retrieved 9 February 2017.
- ^ "Records provisionales de altas presiones batidos el 9 de enero de 2015". tiempo.com. 11 January 2015. Retrieved 1 December 2015.
- ^ "Presión récord en muchos lugares de España en enero" (in Spanish). Levante. 27 January 2015. Retrieved 1 December 2015.
- ^ "Los 12 fenómenos naturales y meteorológicos del año". Noticias de El tiempo. 29 December 2015. Retrieved 10 August 2016.
- ^ (España) (29 January 1905). "Boletín del Domingo 29 de Enero do 1905". Boletín meteorológico diario (1893-2007) (in Spanish). hdl:20.500.11765/6290. Retrieved 22 July 2020.
- ^ Rubio, José Miguel Viñas (2001). "Los temporales de viento en la Península Ibérica Análisis meteorológico de la extraordinaria situación atmosférica de febrero de 1941". Gerencia de Riesgos y Seguros (Fundación MAPFRE). 74. Retrieved 1 December 2015.
- ^ a b "AVANCE CLIMATOLÓGICO MENSUALENERO DE 2015 EN ILLES BALEARS" (PDF) (in Spanish). AEMET. Retrieved 14 June 2015.
- ^ "Portugal registou extremo absoluto da pressão atmosférica no dia 9". Por Sul Informação. 14 January 2015. Retrieved 12 June 2015.
- ^ Salvado, Sandra; Piteira, Sara (15 January 2015). "Pressão atmosférica provoca cefaleias e mudanças de humor". RTP. Retrieved 12 June 2015.
- ^ "Janeiro de 2015" (PDF). Boletim Climatológico Mensal. Instituto Português do Mar e da Atmosfera. ISSN 2183-1076. Retrieved 14 June 2015.
- ^ Taborda, João Paulo (2006). "O temporal de 3 a 6 de Dezembro de 1739 em Portugal - reconstituição a partir de fontes documentais descritivas". Finisterra (in Portuguese). XLI (82): 73–86. Retrieved 27 July 2016.
- ^ de Freitas, Joana Gaspar; Dias, João Alveirinho (2 January 2013). "1941 windstorm effects on the Portuguese Coast. What lessons for the future?". Journal of Coastal Research. 65: 714–719. doi:10.2112/SI65-121. S2CID 129952992.
- ^ Muir-Wood, Robert (2011). "The 1941 February 15th Windstorm in the Iberian Peninsula" (PDF). Trébol. 56: 4–13. Retrieved 27 July 2016.
- ^ Galdies, Charles (2011). "The Climate of Malta: statistics, trends and analysis 1951-2010" (PDF). National Statistics Office, Malta. Retrieved 12 August 2015.
- ^ "Daily Weather Report". Meteorological Report for the Year 1907. Issued by the Survey Department, Cairo. Retrieved 11 July 2020.
- ^ "Nomination of Surtsey for the UNESCO World Heritage List" (PDF). Icelandic Government. 30 January 2007. Retrieved 30 May 2018.
- ^ "Mariners Weather Log Vol. 59, No. 3, December 2015". www.vos.noaa.gov. NOAA. Retrieved 2 February 2017.
- ^ Bancroft, George P. (August 2017). "Marine Weather Review – North Atlantic Area September to December 2016" (PDF). Mariners Weather Log. 61 (2). Retrieved 6 September 2017.
- ^ @Simon_Cardy (6 December 2015). "Since 1950 - a tiny trend for winters to have lower pressure near Iceland/Greenland, & higher in central/S Europe" (Tweet) – via Twitter.
- ^ Burt, Stephen (July 2009). "Long-term variations in extremes of barometric pressure in the British Isles". Weather. 64 (7): 187–189. Bibcode:2009Wthr...64..187B. doi:10.1002/wea.420. S2CID 121108216. Retrieved 31 May 2015.
- ^ a b Tubi, Amit; Dayan, Uri (May 2013). "The Siberian High: teleconnections, extremes and association with the Icelandic Low" (PDF). International Journal of Climatology. 33 (6): 1357–1366. Bibcode:2013IJCli..33.1357T. doi:10.1002/joc.3517. S2CID 140175376. Retrieved 8 August 2015.
- ^ Polak, Franziska (13 March 2013). "Wetter: Ungewöhnlich hoher Luftdruck über Nordosteuropa" (in German). Wetter.net. Retrieved 8 June 2015.
Notes[edit]
List of atmospheric pressure records in North America (and Pacific)[edit]
Greenland[edit]
Model forecast MSLP over central Greenland should always be interpreted with significant uncertainty because the surface is at 700 hPa / 3km above sea level -https://twitter.com/SimonLeeWx/status/1597600418452103169
https://twitter.com/dmidk/status/1377601722038812672
http://www.meteolink.nl/weer-records-nederland-en-de-wereld/ Luchtdruk: Hoogst: 1059,6 hPa, 18 januari 1958 in Upernarvik Laagst: 936,2 hPa, 14 december 1986, 16 januari 1988 resp. Ikermiuarsuk en Paamiut
DMI 1958-2016 http://www.dmi.dk/groenland/arkiver/vejrekstremer/ Højeste lufttryk: 1059,6 hPa 18. januar 1958 Upernavik
Laveste lufttryk: 936,2 hPa 14. december 1986 Ikermiuarsuk 16. januar 1988 Paamiut
15 January 1940 1070 hPa est with 15 January 1940 Myggbukta, Greenland 1064.8 reported by Norwegians https://books.google.co.uk/books?id=8WSXBwAAQBAJ&pg=PA125&lpg=PA125&dq=16+Jan+1882++luftdruck&source=bl&ots=bTCFQTl2Hc&sig=5kya5z4POJ5K9iYEw1hFLQ0sw-s&hl=en&sa=X&ved=0ahUKEwiu2MOcyKzOAhXTFsAKHW9DB2IQ6AEIHjAA#v=onepage&q=16%20Jan%201882%20%20luftdruck&f=false
1062.3 hectopascals (millibars) at 06.00 this morning was the previous record of 1059.6 millibars set 18 January 1958 in Upernarvik http://www.adressa.no/vaeret/article7270389.ece http://www.aftenposten.no/norge/Malte-monster-hoytrykk-i-Arktis-124933b.html
Research has suggested that very quiet solar periods with reduced sunspot activity are connected to zones of high pressure in the high latitudes, which favor colder than normal air in the eastern United States and Western Europe. Records for high pressure over Greenland were set in 2009-2010, https://www.washingtonpost.com/news/capital-weather-gang/wp/2018/06/21/its-very-early-but-signs-are-growing-that-next-winter-could-be-snowy-in-washington/?Ssfdsdfsfddsfsdfds&utm_term=.7e2165c9bacd
https://trj.blog.is/blog/trj/entry/2276639/
Canada[edit]
La pression atmosphérique (réduite au niveau de la mer) la plus élevée a été enregistrée à Dawson, Yukon avec 1079,50 hPa le 02/02/1989 ;
La pression atmosphérique (réduite au niveau de la mer) la plus basse a été de 940,20 hPa à Rue Anthony, Nfld le 20/01/1977 ;
http://la.climatologie.free.fr/record0.htm#divers
while the lowest on record at Gander, Newfoundland between 1942 and 1971 was 946.3mbar on 9 February 1964 (Ludlum 1971).Burt1986
USA[edit]
https://www.wunderground.com/resources/pressure_records.asp?MR=1 http://www.weather.gov/gid/106227
- highest 31 January 1989 Northway, Alaska 1078.6 hPa 31.85 inHg.[1]
The highest measured barometric pressure in the U.S. is 1078.6 millibars which was recorded on January 31, 1989 -http://www.weather.com/science/weather-explainers/news/arctic-blast-record-high-pressure-plains at Dawson City, Yukon, next door to Alaska, but in Canada a higher reading of 1079.6 mb (31.88”) was measured a few days later on February 2, 1989.- http://www.wunderground.com/blog/weatherhistorian/comment.html?entrynum=51 +In the contiguous United States, the highest-pressure reading yet measured is 1064 mb (31.42”) at Miles City, Montana on December 24, 1983. Many people may remember this as the coldest Christmas in modern U.S. history (at least for almost everywhere east of the Rockies).The second highest pressure was also recorded in Montana, this time at Helena on January 10, 1962 with a reading of 1063.3 mb (31.40”). The cold wave associated with this event was just as extreme as that of 1989. The January 1962 event is considered the greatest anti-cyclone ever observed in the United Sates although its point maximum is just shy of that of in 1983.
2015 http://www.weather.com/science/weather-explainers/news/arctic-blast-record-high-pressure-plains +Extreme anti-cyclones are not unique to land masses. Stephen Burt points out that a mid-Atlantic anti-cyclone resulted in a pressure of 1057 mb (31.21”) at a location around 51°N 27°W on January 28, 2003.
A value of 31.43 in (1063.6 mbars) was recorded at Barrow, AK, on 3 January 1970 (Schmidli, 1983). This is the record high pressure for the U.S.[2]
North America’s highest sea level pressure is 31.85 in (1078.6 mbars) and was recorded at Northway, AK [62”59’N, 141043’ W] on 31 January 1989 (Ludlum, 1989; LeComte, 1990). Ludlum notes that during January 1989, a massive Siberian high pressure system brought record cold temperatures to over 20 stations in Alaska. Temperatures dipped to -76°F (-60”C) at Tanana and -75°F (-59.4”C) at McGrath, and Nome had its coldest month since records began in 1906. This record high pressure surpassed the old record of 31.53 in (1067.7 mbars) that occurred at Mayo, Yukon Territory, Canada on 1 January 1974 (Schmidli, 1983), and appeared in the 1985 version of “World Weather Extremes.”[2]
Central Nebraska Regional Airport at Grand Island reached 1056.9 millibars around mid-day on the 7th, breaking the previous high sea level pressure record of 1054.5 millibars set back on December 24, 1983.-http://www.weather.gov/gid/106227
- Lowest
January_1913_Atlantic_coast_storm The lowest confirmed barometric pressure reading, 955.0 mb (28.20 inHg), for a non-tropical system in the continental United States (CONUS) was recorded during this storm at Canton, New York.[2][3]
equalled at Block Island, Rhode Island on 7 March 1932 (Ludlum 1962). Burt1986
October_2010_North_American_storm_complex, The cyclone's lowest minimum pressure of 953 mbar (28.11") made it the most intense extratropical cyclone ever recorded in the continental United States, surpassing the lowest US pressure of 958 mbar from the Great Ohio Blizzard of 1978.[3]
On the West Coast the lowest pressure measured on land was 962 mb (28.40”) at Quillayute, Washington on December 1, 1987. However, a ship near the mouth of the Umpqua River in Oregon measured a pressure of 955 mb (28.20”) during the Storm King of Jan.9, 1880.[4]http://www.climate.washington.edu/stormking/January1880.html
US cities records-https://www.wunderground.com/resources/pressure_records.asp
North America’s lowest sea level pressure (TROPICAL) is 26.35 in (892.3 mbars) and occurred at Matecumbe Key, FL, U.S. [-24”56N, 80°37’ W], on 2 September 1935 (Schmidli,1983).[2]
Sandy 940? Don't forget about the Norfolk and Long Island hurricane of 1821. You could say that the observations aren't reliable(1821..:whistle:) but the wind obs(adjusted for latitude), argue for something below or around 930mb. The classic 1938 long island express bottomed out around 938mb.https://www.americanwx.com/bb/topic/13167-intense-natl-low/
949.5mb - September 21, 1938 (Hurricane of '38)https://www.nbcconnecticut.com/weather-news/stories/exceptionally-low-barometric-pressure/2220629/
Alaska lowest August https://twitter.com/Climatologist49/status/1300296620441874434 Alaska lowest-https://www.smhi.se/bloggar/vaderleken-2-3336/extrema-hogtryck-och-lagtryck-kring-arsskiftet-1.167539
Pacific[edit]
Aleutian cyclone 2015 924 hPa tying the record for lowest wintertime pressure in the North Pacific Ocean since records began in the winter of 1969-1970. The low equals the record set by post-tropical Nuri November_2014_Bering_Sea_cyclone (920 hPa) in November 2014.[5]
- http://mashable.com/2015/12/15/massive-alaska-storm/#J38Xi2sk8iqE
- https://www.facebook.com/NWSOPC/videos/973195089405889/
- https://twitter.com/NWSOPC/status/676053741393616896
- https://weather.com/storms/hurricane/news/bering-sea-superstorm-alaska-aleutians-20141105
- https://www.washingtonpost.com/news/capital-weather-gang/wp/2014/11/08/bering-sea-storm-now-strongest-on-record-in-north-pacific/
25-26 de octubre de 1977. Dutch Harbor, en la isla Aleutian de Unalaska, registró una presión mínima de 926 mb en la tarde del 25 de octubre.http://www.tiempo.com/ram/25845/los-records-del-mundo-de-bajas-presiones-parte-iii-y-final/ 926, Burt.[6]
April 6 2011, Bering Sea on April 6th with a minimum pressure of 939 mb (27.73”).[6]
S Korea[edit]
Lowest: Sarah 1959 951.5 hPa
- Maysak 3 Sept 2020, Tongyeong 952.5 hPa-https://twitter.com/sayakasofiamori/status/1301453496672120833
- Maemi 2003, 954 hPa https://twitter.com/sayakasofiamori/status/1301172428177981443
Japan[edit]
https://twitter.com/sayakasofiamori/status/1300968941074882561 https://news.yahoo.co.jp/byline/morisayaka/20200904-00196299/ https://twitter.com/sayakasofiamori/status/1571410700144345088 https://yaleclimateconnections.org/2022/09/hurricane-fiona-deluges-puerto-rico-typhoon-nandamol-hits-japan/
Arctic[edit]
[August] An intense cyclone is currently moving into the Arctic Ocean & deepening as it interacts with an upstream TPV. The GFS modeled MSLP min of 967 hPa would be near the record lowest for the North American side of the Arctic per an hourly 1979-2018 ERA5 climo (h/t @splillo). https://twitter.com/burgwx/status/1164944382509928449 https://twitter.com/splillo/status/1164936322877931521
So Hem[edit]
1048 Trewin http://forum.weatherzone.com.au/ubbthreads.php/topics/74443/Very_high_atmospheric_pressure
Aus[edit]
Australia’s highest pressure on record was 1044.3 mb (30.84”) at Launceston, Tasmania on June 7, [7]1967.https://www.wunderground.com/blog/weatherhistorian/world-and-us-anticyclonic-high-barometric-pressure-records
An estimate, based on Dvorak intensity, during Cyclone Monica in Australia’s Gulf of Carpentaria. The U.S. Navy Joint Typhoon Warning Center estimated a pressure of 879 mb (25.96”) and perhaps as low as 869 mb (25.66”) based on the Dvorak intensity on April 23, 2006. These figures, however, are not accepted by the Australian Bureau of Meteorology that places a minimum pressure for the storm at 905 mb (26.72”) on the same date and location. The lowest pressure actually measured in Australia was also 905 mb on the North Rankin A Gas Platform of the coast of Western Australia during Cyclone Orson on April 22, 1989.[8]It was later surpassed by Severe Tropical Cyclone Gwenda in 1999 when that storm attained a pressure of 900 hPa (mbar).
NZ[edit]
- Highest
1045.9 set in Wellington in 1889.[9]
Niwa the highest air pressure ever recorded in the South Island and Chatham Islands has just been recorded at 1044hPa, the centre of the high (East of East Cape) is estimated to today touch 1050hPa.[9] South island record at this point?
- Lowest
The lowest on record for New Zealand is 954 mbar at Taiaroa Head, Otago Peninsula on 16 January 1939, although 945.1 mbar was recorded at Campbell Island (52°S 169°W, almost midway between New Zealand and Antarctica) on 18 July 1982 (Collen 1983), the lowest at that site since records commenced in 1941.[10]
Falkland Islands[edit]
955 hPa [10]
South Georgia[edit]
In the South Atlantic the lowest recorded pressure at Grytviken on South Georgia (54° 16' S 36° 30' W) in 36 years 1929-64 was 942mbar (Meteorological Office 1967),[10]
Antarctica[edit]
casey
Aside from this remarkable figure the lowest other readings from the region include 934 mb (27.59”) at Halley Bay, Antarctica on Aug. 11, 1994, 942 mb (27.82”) at Grytviken on South Georgia Island (54° 16’S 36° 30’W) sometime between 1929-1964, and 945.1 mb (28.17”) at Campbell Island located about halfway between New Zealand and Antarctica (52°S 69°W) on July 18, 1982.https://www.wunderground.com/blog/weatherhistorian/world-and-us-lowest-barometric-pressure-records
https://www.tiempo.com/ram/borrasca-record-de-bajas-presiones-de-900-hpa-sorprende-a-los-meteorologos.html 923 https://twitter.com/WxTca/status/1581856999154733057
Russian winter (meteorology)[edit]
"Beast from the east", russian whip, nl siberian bear
1991 (no ssw) hig pressure Norway.cold winter weather in Western Europe is not always the result of an SSW. This is clearly visible when we look at the five coldest February months in the Netherlands, based on the cold number, over the past 60 years. In these years only the cold February of 1963 was preceded by an SSW, the others of 1985, 1986, 1991 and 2012 did not follow an SSW. The SSW of 12 February this year was the harbinger of the current winter cold in the Netherlands, which was predicted for a long time by the weather models.-http://www.knmi.nl/over-het-knmi/nieuws/koude-week-door-verzwakte-poolwervel
planetary vorticity -http://wattsupwiththat.com/2014/02/08/when-does-a-displaced-polar-vortex-becomes-a-split-vortex/ polar vortex splits and bombs http://www.dailykos.com/story/2013/01/17/1179397/-Sudden-Stratospheric-Warming-Split-the-Polar-Vortex-in-Two
"Russian Winter" http://www.livescience.com/31153-keeping-europe-cold-snowy.html http://modis.gsfc.nasa.gov/gallery/individual.php?db_date=2012-02-14
"The ice-free areas of the ocean act like a heater as the water is warmer than the Arctic air above it. This favours the formation of a high-pressure system near the Barents Sea, which steers cold air into Europe."confirmed a link between the loss of Arctic sea ice and the development of high-pressure zones in the polar region, which influence wind patterns at lower latitudes further south.But UK climate researcher Adam Scaife said other complexities are almost certainly influencing the current cold spell. "There is a pretty clear link between the current event and the upper level winds... The winds up at 30km (18.6 miles) altitude are very weak," he said. "We have verified several times using computer model experiments that this leads to high pressure across northern Europe and cold winter conditions in the UK as we see now."-http://www.independent.co.uk/news/science/science-behind-the-big-freeze-is-climate-change-bringing-the-arctic-to-europe-6358928.html
National ice days[edit]
1956, 12-18 feb Sweden-https://www.smhi.se/bloggar/vaderleken-2-3336/langre-perioder-med-nationella-isdygn-1.131313 and https://www.smhi.se/kunskapsbanken/vad-ar-isdygn-och-frostdygn-1.35582
schweiz-62-63 http://www.meteoschweiz.admin.ch/home.subpage.html/de/data/blogs/2018/2/eiszeit-in-der-schweiz.html
1956[edit]
Three extreme instances of 1000–500mbar thicknesses of 500dam or lower have been recorded in the UK during the last 60 years: in a northerly airflow at Stornoway, Outer Hebrides, where exactly 500dam was measured by radiosonde at 1200 utc on 7 February 1969; at Hemsby, Norfolk, where 497dam was reported at 1200 utc on 1 February 1956 and, again at 1200 utc, on 12 January 1987. For our purposes, we shall define these rare cold pools of 500dam or lower over the UK in winter as extreme. http://onlinelibrary.wiley.com/doi/10.1002/wea.666/full
1956 cold Austria http://www.zobodat.at/pdf/MittNatVerSt_87_0069-0073.pdf “It’s the worst snow since 1956,”http://wattsupwiththat.com/2012/02/05/tragic-winter-weather-in-europe-doesnt-fit-the-mannian-narrative/ 1956 cold wave France http://www.meteofrance.fr/actualites/33129618-fevrier-1956-vague-de-froid-en-france
from Cold wave-*1956 European cold wave – February 1956 was the coldest month of the twentieth century over large areas of Western Europe,[11] with mean temperatures below 0 °C (32 °F) as far south as Marseilles being utterly unprecedented in records dating back into the eighteenth century.
2012[edit]
The strong surface anticyclone was associated with a strong mid-tropospheric anticyclone at 500 hPa. Strong anticyclones over Russiaridging into Western Europe are historically linked to record cold episodes in central and WesternEurope. Similar to previous massive anticyclones over Russia, this anticyclone pushed arcticair into eastern,central, eventually into WesternEurope. [12] the anticyclone was able to tap cold air from Siberia and advect it westward and this second air mass was considerable colder than the initial “news worthy” air mass which affected the region on 30-31 January 2012.[12] After that, the high pressure system further developed and expanded over northwestern Russia and northern Europe. In accordance with the westward expansion of the high pressure system, cold air mass around Kazakhstan flowed westward over the southern side of the high pressure and reached eastern and central Europe in early February.[13]
Climatologies of northern hemisphere anticyclones (Galarneauet al. 2008;Bell and Bosart 1989, and Barriopedro2006) suggestthis event occurred in region where closed500 hPa anticyclones and surface anticyclonestypically form during the winter months.[12]Interestingly, northern hemispheric blocking events were found to be stronger and more frequent during La Niña year than El Niño years.[12]
Based on NCEP/NCAS re-analysis data pressure greater than 1064 hPa observed (globally/nth hemosphere???) observed 941 times since 1948.[12] Values over 1080 hPa observed 6 times, with three occurrences in winter 1958, and one time each in 1955, 1960 and 2010.[12] (misses or omits the record value 1968) http://blog.metoffice.gov.uk/2012/02/09/whats-bringing-the-cold-weather-to-europe-and-the-uk/
"*No* blocky N Atl winters since '70 outside +/- 2 yrs of solar mins. Probably not coincidence. Next min 4-5 yrs away "https://twitter.com/tcrawf_nh/status/646702459646251008
BAMS 2012 SIDEBAR 7.4: COLD SPELL IN EURASIA IN WINTER 2011/12— B. MÜHR, C. EHMANN, P. BISSOLLI, D. PARKER, J. KENNEDY, S. TANAKA, AND K. YOSHIMATSU Mühr, B., C. Ehmann, P. Bissoli, D. Parker, J. Kennedy, S. Tanaka, K. Yoshimatsu, 2013: Cold Spell in Eurasia in Winter 2011/12, Bull. Amer. Meteor. Soc., 94, 182-183.
El Nino & Russian winters[edit]
El Niño Years 1902-1903 1905-1906 1911-1912 1914-1915 1918-1919 1923-1924 1925-1926 1930-1931 1932-1933 1939-1940 1941-1942 1951-1952 1953-1954 1957-1958 1965-1966 1969-1970 1972-1973 1976-1977 1982-1983 1986-1987 1991-1992 1994-1995 1997-1998 -http://ww2010.atmos.uiuc.edu/(Gh)/guides/mtr/eln/def.rxml
solar minima -http://www.bbc.co.uk/blogs/paulhudson/entries/d99e9ee4-2a79-3500-a1d4-07028ecb58d1 List_of_solar_cycles
SSW & Russian winters[edit]
Cold winters in Europe[edit]
- ^ Berliner, Jeff (1 February 1989). "Sky-high barometric pressure prompts deadly FAA warning". UPI. Retrieved 10 January 2020.
- ^ a b c Krause, Paul; Flood, Kathleen (September 1997). "Weather and Climate Extremes". U.S. Army Topographic Engineering Center. Retrieved 23 October 2016.
- ^ "How the upcoming cyclone ranks among other notable cyclones over the Great Lakes..." National Weather Service Chicago. Retrieved 27 October 2010.
- ^ Cite error: The named reference
BurtAK"was invoked but never defined (see the help page). - ^ Halverson, Jeff (14 December 2015). "Bering Sea 'bomb' cyclone ties record for strongest winter storm in North Pacific". Capital Weather Gang: The Washington Post. Retrieved 15 December 2015.
- ^ a b Burt, Christopher (10 November 2011). "Super Extra-tropical Storms; Alaska and Extra-tropical Record Low Barometric | Weather Extremes". www.wunderground.com. Retrieved 3 November 2016.
- ^ Trewin, Blair (February 2015). "Charts from the past with Blair Trewin: 7 June 1967". Bulletin of the Australian Meteorological and Oceanographic Society. 28: 21. Retrieved 7 May 2017.
- ^ Burt, Christopher C. (20 November 2011). "World and U.S. Lowest Barometric Pressure Records | Weather Extremes | Weather Underground". www.wunderground.com. Retrieved 7 May 2017.
- ^ a b "HIGH OVER NZ A "RECORD BREAKER"". WeatherWatch.co.nz. 1 September 2008. Retrieved 7 May 2017.
- ^ a b c Burt, S. D. (February 1987). "A New North Atlantic Low Pressure Record" (PDF). Weather. 42 (2): 53–56. Bibcode:1987Wthr...42...53B. doi:10.1002/j.1477-8696.1987.tb06919.x. Retrieved 16 August 2015.
- ^ J.-M. Hirschi, Joël and Sinha, Bablu; ‘Negative NAO and cold Eurasian winters: How exceptional was the winter of 1962/1963?’; Weather Vol. 62, No. 2 (February 2007); pp. 43-48
- ^ a b c d e f Grumm, Richard H. "The high latitude Eurasian Anticyclone of January-February 2012" (PDF). National Weather Service. Retrieved 17 September 2015.
- ^ "Cold Wave over the Eurasian Continent" (PDF). Tokyo Climate Center, Japan Meteorological Agency. 6 February 2012. Retrieved 17 September 2015.