
User:Mdd/Organizational chart
< User:Mdd

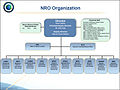
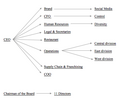
An organizational chart (often called organization chart, org chart, organigram(me), or organogram) is a diagram that shows the structure of an organization and the relationships and relative ranks of its parts and positions/jobs.
History
[edit]Early civilisation figurative examples of organizational activity depicted
[edit]- Sumerian
-
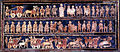 Standard of Ur, war side, c. 2600 BC
 -
 Standard of Ur,peace side, c. 2600 BC
 -
 Standard of Ur at British Museum


_(2).jpg)
- Egypt
-
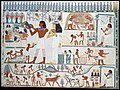 Agricultural Scenes, Tomb of Nakht, 1400–1390 BC
 -
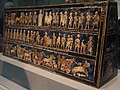
 Depiction of craftworkers in ancient Egypt
 -
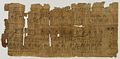 Scene from Book of the Dead, c. 1075–945 BCE


- Maya
-
 Relief with Enthroned Ruler, 8th c.

- Classical Greece, Hellenism, Rome
-
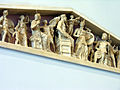 Greece; Part of Parthenon Frieze, 4th c. BC
 -
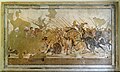 Hellenistic, Alexander Mosaic, 100 BC
 -
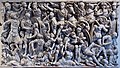 Roman soldiers and Germans, 235 CE
 -
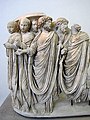 Gordian III and senators, 3th c.
.jpg)


- Early Christianity, Europe
-
 Court of Emperor Justinian, 547
 -
 Empress Theodora and attendants, 547
 -
 Harbaville Triptych, 10th c.

.jpg)

Medieval examples of organizational structures depicted
[edit]-
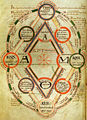 Byrthferth enchiridion, ca. 1080
 -
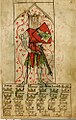
 Hortus Deliciarum, Die Philosophie mit den sieben freien Künsten, 1180
 -
 Family tree of medieval noble family, 12th century
 -
 Coronation of Henry the Lion, 12th century
 -
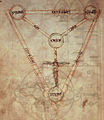 Shield of the Trinity from a manuscript of Peter of Poitiers' writings, c. 1210.
 -
 Jacob van Maerlants, Der naturen bloeme, 13th c.
 -
 King Arthur - Chronicle of England, 1307
 -
 King Henry I and the sinking White Ship, 1307
 -
 King Henry II England and Thomas Becket, 1307
 -
 Round Table in the Grand Hall, Winchester, England, United-Kingdom, 1348
 -
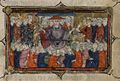
 St. Thomas Aquinas Between Doctors of the Old and New Testaments, 1366
 -
 Philip IV of France, 14th century
 -
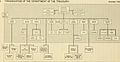
 Organizational Structure of the Empire of the Holy Roman Empire in Nuremberg Chronicle, 1493
 -
 Tuebinger Hausbuch Freie Kuenste, 15th century
 -
 Double-headed eagle with coats of arms of individual states, symbol of the Holy Roman Empire, 1510


.jpg)


- Comment
Earlier examples of pure schemata can be found in the 9th-10th century work of Alcuin's Disputatio de rhetorica et de virtutibus regis Karli et Albini magistri. see for example here, at Digitale Bibliothek - Münchener; or in similar works here at the Bern, Burgerbibliothek; here at St. Gallen, Stiftsbibliothek.
19th century, rise of modern organizational chart
[edit]-
 Royal Society of Arts (Great Britain), 1808
 -
 New York and Erie Railroad Company, 1835
 -
 Listing of company officials and principal officers, 1848
 -
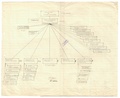
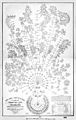 New York and Erie Railroad Diagram representing a plan of organization by D.C. McCallum, 1855
 -
 New York and Erie Railroad Company directors and officers, 1856
 -
 Listing of principal officers by D.C. McCallum, 1856
 -
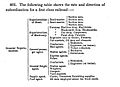 Table of rate and direction of subordination of railroad company by George Leonard Vose, 1857
 -

-
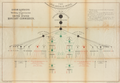 USSC Org chart by John Y. Culyer, 1863
 -
 Marietta and Cincinnati Railroad Company, 1866
 -
 Mobile & Ohio Company, 1885
 -
 Present organization of an Arsenal by Captain Henry Metcalfe, 1885
 -
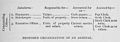 Proposed Organization of Arsenal by Captain Henry Metcalfe, 1885
 -
 Baltimore and Ohio Railroad Company, 1888
 -
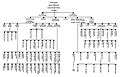
 Skeleton of a Railroad Organization by Edward Porter Alexander, 1889
 -
 Scheme of authority of Railroad Company by T.H Browne, 1894.
 -
 Staff Organisation Diagram by Lewis, J. Slater, 1896
 -
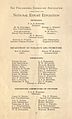 National Export Exhibition, officers and associates, 1899
,_1808.jpg)


20th century
[edit]1900s, rise of general application of organizational charts
[edit]-
 United States Rubber Company organization chart, 1902
 -
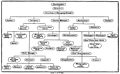
 General subdivision of the departments of a machine shop, 1903
 -
 Further subdivision of the departments of a machine shop, 1903
 -
 Steubenville Traction & Light Co., 1904
 -
 Detroit, Monroe & Toledo Short Line Railway, 1905
 -
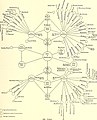
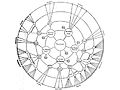
 Father Hagerty's Wheel of Fortune, 1905
 -
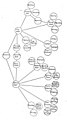 Chart of Business Organization, 1905
 -
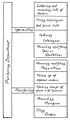 Chart of Purchasing Department, 1905
 -
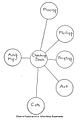 Chart of Advertising Department, 1905
 -
 Chart of Sales Department, 1905
 -
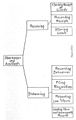 Chart of Stock Department, 1905
 -
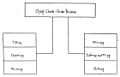 Chart of Order Department, 1905
 -
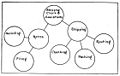 Chart of Shipping Department, 1905
 -
 Organizational Chart, 1905
 -
 Segregation of an Industrial Body into Authorities and Departments, 1905
 -
 Graphic Chart, showing the System of Organization and Management of the Modern American Shop or Manufacturing Plant, 1906
 -
 1908
1908 -
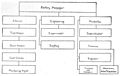
 Chart of Duties, Responsibilities and Authorities of Department Heads, 1909.
 -
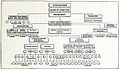
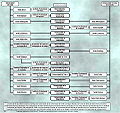
 Chart of a Corporate Manufacturing Enterprise, 1909.
 -
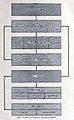 Chart of a Corporate Trading Enterprise, 1909.
 -
 A Chart of Working Authorities in a Manufacturing Business, 1909
 -
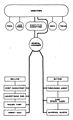 Chart of Working Authorities in a Trading Business, 1909


_(14574490630).jpg)
_(14738063396).jpg)


.jpg)


1910s
[edit]-
 1910
1910 -
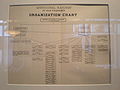
 Outline of Organization Chart, 1914
 -
 Organization Chart of a large Company Manufacturing Stoves, 1914
 -
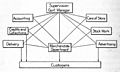 Chart showing Internal Organization of Specialty Store, 1915
 -
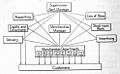 Chart showing Internal Organization of Department Store, 1915
 -
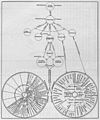
 Wheeled chart of National Bureau of Standards activities, 1915
 -
 Class battle fronts diagram, 1917
 -
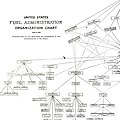 US Federal fuel administrators, 1917 (1)
 -
 US Federal fuel administrators, 1917 (2)
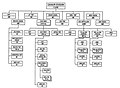
 -
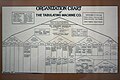 Tabulating Machine Co Org. Chart, 1917
 -
 Schemat organizacyjny, 1918
_(14761454825).jpg)


_(14595967289).jpg)
_(14782285182).jpg)


1920s
[edit]-
 Municipal Railway of SF org chart July 1921
 -
 Radial tree - Graphic Statistics in Management, 1924
 -
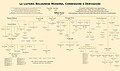
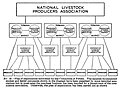 Plan of Organization for National Livestock Producers Association by Randall (1), 1928
 -
 Plan of Organization for National Livestock Producers Association by Randall (1), 1928
 -
 Plan of Organization for National Livestock Producers Association by Randall (3), 1928
 -
 WERAG Organigramm, 1929


,_1928.jpg)
,_1928.jpg)
,_1928_03.jpg)

1930s-40s
[edit]-
 UN-chart, 1931
 -
 Reichsmusikkammer Organigramm, 1934
 -
 Panzer division 1941 organization chart, 1941
 -
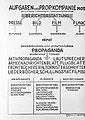 Organigramm Aufgaben einer Propagandakompanie, 1941
 -
 GuadOrg2, 1942
 -
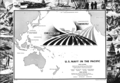
 Cart wheel J. Forces, 1943
 -
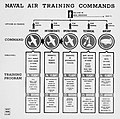 Naval Air Training Command, 1943
 -
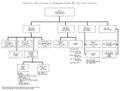
 Naval Air Transport Service chart, 1943
 -
 1943
1943 -
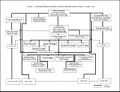
 USAAF Reorganization Chart, 1943
 -
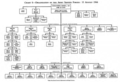
 Supreme Headquarters, Allied Expeditionary Force, 6 June 1944
 -
 1944
1944 -
 1944
1944 -
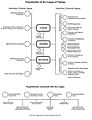
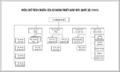
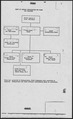
 Manhattan Project Organization Chart, 1946
 -
 CIA Organization, 1947
 -
 8th AF OC, 1947


1950s-1990s
[edit]-
 1950
1950 -
 1952
1952 -
 1952
1952 -
 1952
1952 -
 1952
1952 -
 1953
1953 -
 1954–62
 -
 1955
1955 -
 1956-57
 -
 Drawn in 1959
 -
 1960
1960 -
 1961
1961 -
 1961
1961 -
 1961
1961 -
 1961
1961 -
 1963
1963 -
 1975
1975 -
 1981
1981 -
 1989
1989 -
 1996
1996 -
 1998 (depicting 1943)


_1957.jpg)


_(14778334252).jpg)


_1963.png)


21st century
[edit]2000–09
[edit]-
 2000
2000 -
 2002
2002 -
 2004
2004 -
 2005
2005 -
 2005
2005 -
 2006
2006 -
 2006
2006 -
 2006
2006 -
 2007
2007 -
 2007
2007 -
 2007
2007 -
 2008
2008 -
 2008
2008 -
 2008
2008 -
 2008
2008 -
 2008
2008 -
 2008
2008 -
 2008
2008 -
 2008
2008 -
 2008
2008 -
 2009
2009 -
 2009
2009 -
 2009
2009


2010s
[edit]-
 2010
2010 -
 2010
2010 -
 2010
2010 -
 2010
2010 -
 2010
2010 -
 2010
2010 -
 2010
2010 -
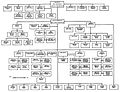
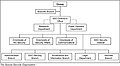
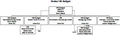
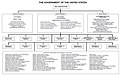 Government of the United States, 2011.
 -
 Department of National Defence, Canada, 2011
 -
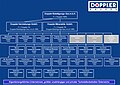 Doppler Gruppe, 2011
 -
 US Department of Defence, 2012
 -
 2012
2012 -
 McDonald's Corporate Structure, 2012
 -
 2012
2012 -
 2012
2012 -
 2013
2013 -
 2013
2013 -
 2013
2013 -
 2013
2013 -
 2014
2014


Types of organizational charts
[edit]Specific organizational structures
[edit]-
 Line
Line -
Line staf
-

-
Project organization
-
 Corporate structure
 -
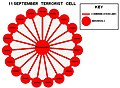
Security clearance organizational chart


Different shapes of organizational diagrams
[edit]-
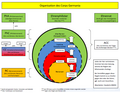
 3D Bubble diagram
 -
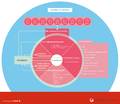
 Concetric
 -
 Conceptual model
 -
Infographic
-
Network
-
Pie
-
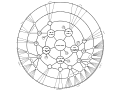 Radial tree
 -
 Table
Table -
Timeline
-
Tree, horizontal
-
Tree, vertical
-
Venn diagram


Present versus proposed charts
[edit]The use of charts as a designers tool
-
Present organization of an Arsenal by Captain Henry Metcalfe, 1885
-
Proposed Organization of Arsenal by Captain Henry Metcalfe, 1885
Features
[edit]-
 Flat or wide organization
 -
 Long organization
 -
 Communication lines
 -
 With icons
 -
With flows
-
With map
-
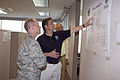
 Pin wall


.svg)


Tools
[edit]

Charts in practice
[edit]-
 1945
1945 -
 1947
1947 -
 2001
2001 -
 2008
2008 -
 2011
2011 -
 2012
2012 -
 2016
2016


See also
[edit]Wikiquote has quotations related to Mdd/Organizational chart.