
User:Moonraker/2020
- Statewide opinion polling for the 2020 United States presidential election
- Nationwide opinion polling for the 2020 United States presidential election
- Texas at fivethirtyeight.com
39 Solid States[edit]
16 Rock Solid Republican[edit]
| Rock Solid State Republican | Odds | EC votes |
|---|---|---|
| R (100) | 9 | |
| R (100) | 4 | |
| R (100) | 6 | |
| R (200) | 8 | |
| R (200) | 8 | |
| R (50) | 6 | |
| R (66) | 10 | |
| R (100) | 3 | |
| R (100) | 5 | |
| R (300) | 3 | |
| R (100) | 7 | |
| R (25) | 9 | |
| R (100) | 3 | |
| R (100) | 11 | |
| R (100) | 5 | |
| R (100) | 3 |
13 Rock Solid Democrat[edit]
| Rock Solid State Democrat | Odds | EC votes |
|---|---|---|
| D (300) | 55 | |
| D (66) | 7 | |
| D (66) | 3 | |
| D (100) | 4 | |
| D (100) | 10 | |
| D (100) | 11 | |
| D (100) | 20 | |
| D (25) | 14 | |
| D (100) | 29 | |
| D (25) | 7 | |
| D (100) | 4 | |
| D (100) | 3 | |
| D (25) | 12 |
4 Fairly Solid Republican States[edit]
| Fairly Solid Republican States | Odds | Lead 2016 | EC votes |
|---|---|---|---|
| Alaska 2020 | R (10) | 14.7 | 3 |
| Arkansas 2020 | R (12) | 26.9 | 6 |
| Indiana 2020 | R (12) | 19.0 | 11 |
| Utah 2020 | R (14) | [c. 25] | 6 |
6 Fairly Solid Democratic States[edit]
| Fairly Solid Democratic States | Odds | Lead 2016 | EC |
|---|---|---|---|
| Colorado 2020 | D (10) | D 4.9% | 9 |
| Maine 2020 | D (7) | D 3.0% | 4 |
| Minnesota | D (6) | D 1.5 % | 10 |
| Nevada 2020 | D (5) | D 2.4% | 6 |
| New Mexico 2020 | D (7) | D 8.2% | 5 |
| Virginia 2020 | D (7) | D 5.3% | 13 |
The 11 Swing States[edit]
| Swing State | Republican Odds |
Democrat Odds |
2016 lead | EC votes | R | D | ? |
|---|---|---|---|---|---|---|---|
| Arizona 2020 | 6/5 | 8/13 | R 3.5% | 11 | |||
| Florida | 8/13 | 6/5 | R 1.2% | 29 | |||
| Georgia 2020 | 4/7 | 5/4 | R 5.1% | 16 | |||
| Iowa 2020 | 4/7 | 5/4 | R 9.4% | 6 | |||
| Michigan 2020 | 11/4 | D (5) | R 0.2% | 16 | |||
| New Hampshire 2020 | D (3) | D 0.3% | 4 | ||||
| N. Carolina 2020 | 5/6 | 5/6 | R 3.7% | 15 | |||
| Ohio 2020 | 4/6 | 11/10 | R 8.1% | 18 | |||
| Penn. 2020 | 6/4 | 1/2 | R 0.7% | 20 | |||
| Texas 2020 | 2/5 | 7/4 | R 9.0% | 38 | |||
| Wisconsin 2020 | 11/8 | 8/15 | R 0.8% | 10 |
Tallies[edit]
- 16 Rock Solid Republican: 100 electors
- 16 Rock Solid Democratic: 181 electors
- 4 Fairly Solid PI Republican States: 26 electors
- 6 Fairly Solid PI Democratic States: 47 electors
- R: 100 + 26 = 126
- D: 181 + 47 = 228
- Swing states: 183 electors
Scenarios for swing states[edit]
- Trump only holds Texas, Ohio, and Iowa: Result
R: 100 + 26 + 62 = 188
D: 181 + 47 + 121 = 349... Biden wins - Biden only wins Michigan 16, New Hampshire 4, Wisconsin 10, Pennsylvania 20: Result
R: 100 + 26 + 133 = 259
D: 181 + 47 + 50 = 278... Biden wins
Texas notes[edit]
- 2016 United States presidential election in Texas Percentages 2016: Trump 52.23%, Clinton 43.24%
- US Percentages 2016: Trump 46.1%, Clinton 48.2%
- Nationwide opinion polling for the 2020 United States presidential election at 12 July 2020: Trump 45.1%, Biden 54.9%
Graphical summary[edit]
| Graphs are unavailable due to technical issues. There is more info on Phabricator and on MediaWiki.org. |
Aggregate polls[edit]
| Source of poll aggregation |
Dates administered |
Dates updated |
Joe Biden Democratic |
Donald Trump Republican |
Other/ Undecided [a] |
Margin |
|---|---|---|---|---|---|---|
| 270 to Win | Oct 29, 2020 – November 2, 2020 | November 3, 2020 | 47.5% | 48.8% | 3.7% | Trump +1.3 |
| Real Clear Politics | October 20–31, 2020 | November 3, 2020 | 46.5% | 47.8% | 5.7% | Trump +1.3 |
| FiveThirtyEight | until November 2, 2020 | November 3, 2020 | 47.4% | 48.6% | 4.0% | Trump +1.1 |
| Average | 47.1% | 48.4% | 4.5% | Trump +1.2 | ||
Polls[edit]
| Poll source | Date(s) administered |
Sample size[b] |
Margin of error |
Donald Trump Republican |
Joe Biden Democratic |
Jo Jorgensen Libertarian |
Howie Hawkins Green |
Other | Undecided |
|---|---|---|---|---|---|---|---|---|---|
| SurveyMonkey/Axios | Oct 20 – Nov 2, 2020 | 9,226 (LV) | ± 1.5% | 51%[c] | 47% | – | – | – | – |
| Swayable Archived November 13, 2020, at the Wayback Machine | Oct 27 – Nov 1, 2020 | 1,151 (LV) | ± 3.9% | 51% | 47% | 1% | 0% | – | – |
| Data For Progress | Oct 27 – Nov 1, 2020 | 926 (LV) | ± 3.2% | 48% | 49% | 1% | 1% | 0%[d] | – |
| AtlasIntel | Oct 30–31, 2020 | 686 (LV) | ± 4% | 50% | 47% | – | – | 3% | – |
| Emerson College | Oct 29–31, 2020 | 763 (LV) | ± 3.5% | 49%[e] | 48% | - | - | 2%[f] | – |
| Morning Consult | Oct 22–31, 2020 | 3,267 (LV) | ± 2% | 48% | 48% | – | – | – | – |
| Public Policy Polling | Oct 28–29, 2020 | 775 (V) | – | 48% | 50% | – | – | – | 2% |
| Gravis Marketing | Oct 27–28, 2020 | 670 (LV) | ± 3.8% | 50% | 45% | – | – | – | 5% |
| RMG Research/PoliticalIQ Archived October 30, 2020, at the Wayback Machine | Oct 27–28, 2020 | 800 (LV) | ± 3.5% | 50%[g] | 46% | – | – | 2%[f] | 2% |
| 48%[h] | 48% | – | – | 2%[f] | 2% | ||||
| 52%[i] | 44% | – | – | 2%[f] | 2% | ||||
| SurveyMonkey/Axios | Oct 1–28, 2020 | 15,145 (LV) | – | 51% | 47% | – | – | – | – |
| Swayable | Oct 23–26, 2020 | 552 (LV) | ± 5.7% | 49% | 48% | 3% | 1% | – | – |
| YouGov/UMass Amherst | Oct 20–26, 2020 | 873 (LV) | ± 4.2% | 48% | 47% | 2% | 1% | 0%[j] | 1% |
| Data for Progress (D) | Oct 22–25, 2020 | 1,018 (LV) | ± 3.1% | 48% | 49% | 1% | 0% | – | 2% |
| Siena College/NYT Upshot | Oct 20–25, 2020 | 802 (LV) | ± 3.8% | 47% | 43% | 3% | 0% | 2%[k] | 5%[l] |
| Univision/University of Houston/Latino Decisions/North Star Opinion Research |
Oct 17–25, 2020 | 758 (RV) | ± 3.56% | 49% | 46% | – | – | 3%[m] | 2% |
| Citizen Data | Oct 17–20, 2020 | 1,000 (LV) | ± 3% | 45% | 49% | 1% | 0% | 1% | 4% |
| YouGov/University of Houston | Oct 13–20, 2020 | 1,000 (LV) | ± 3.1% | 50% | 45% | 2% | 0% | – | 3% |
| University of Texas at Tyler/Dallas Morning News | Oct 13–20, 2020 | 925 (LV) | ± 3.2% | 47%[e] | 49% | 3% | 1% | – | 1% |
| Morning Consult | Oct 11–20, 2020 | 3,347 (LV) | ± 1.7% | 47% | 48% | – | – | – | – |
| Quinnipiac University | Oct 16–19, 2020 | 1,145 (LV) | ± 2.9% | 47% | 47% | – | – | 1%[n] | 5% |
| Data for Progress (D) | Oct 15–18, 2020 | 933 (LV) | ± 3.2% | 46%[e] | 47% | 2% | 1% | – | 5% |
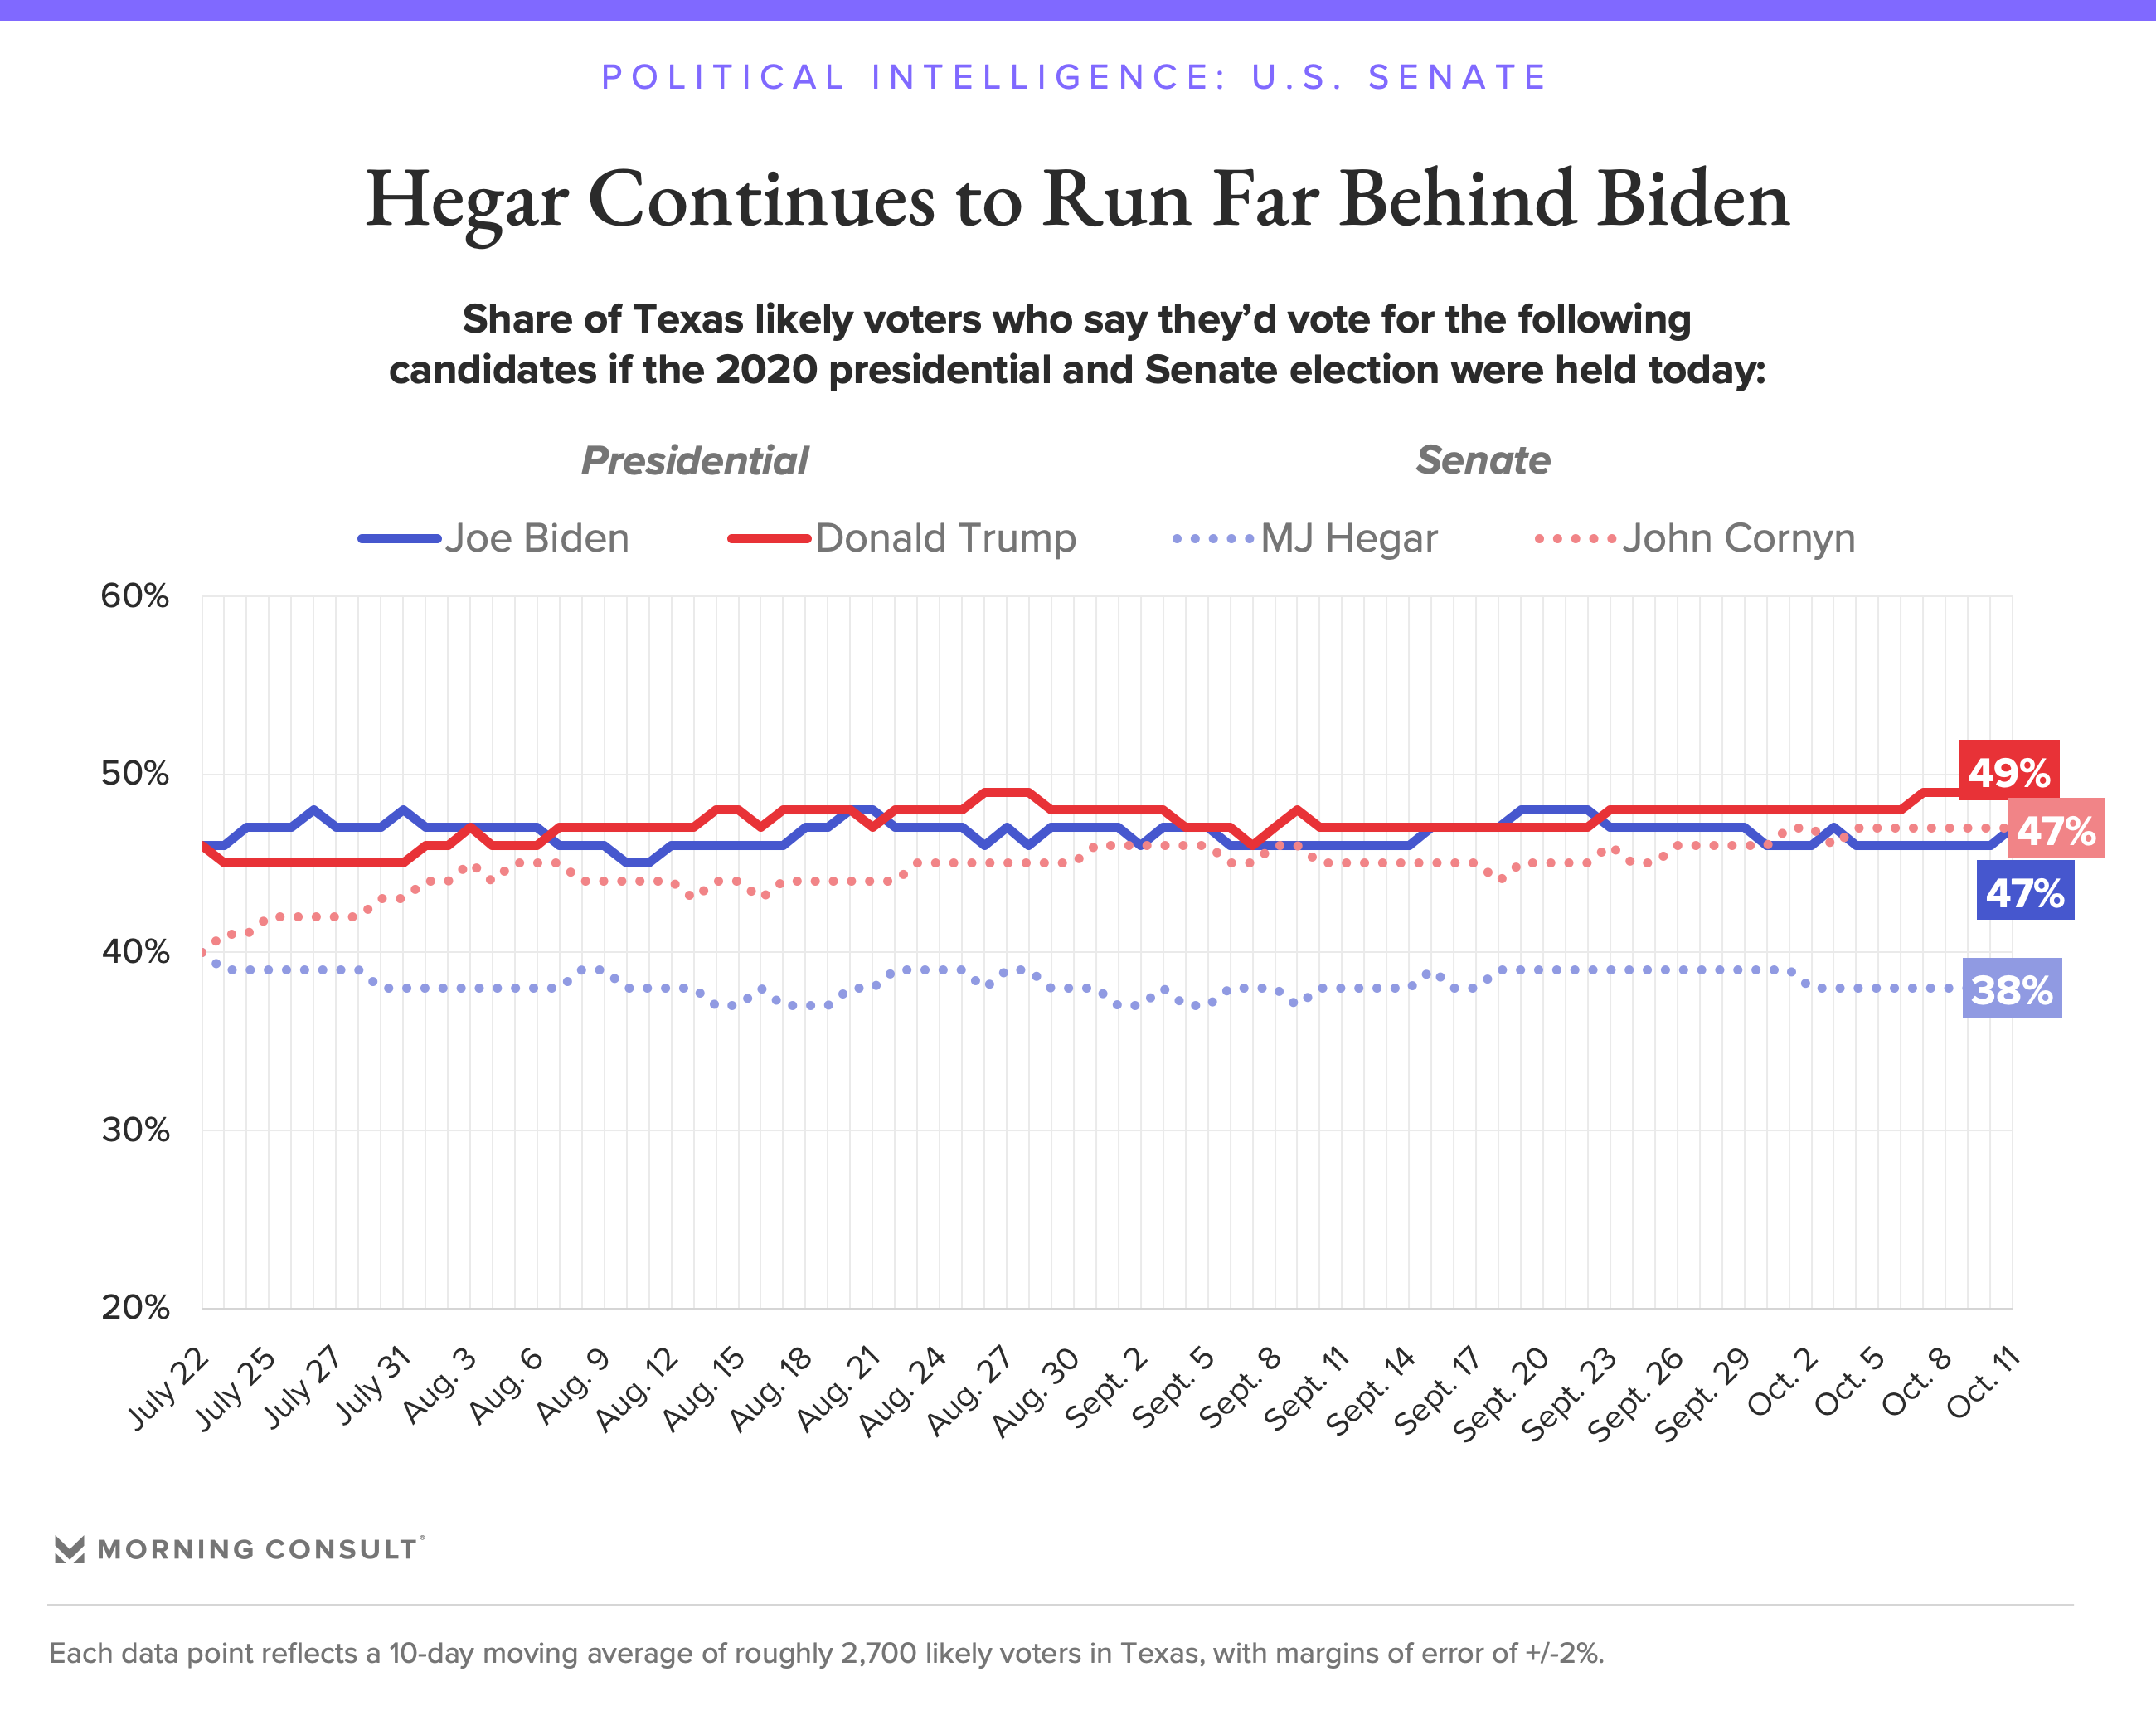
| Morning Consult[1] | Oct 2–11, 2020 | 3,455 (LV) | ± 1.7% | 49% | 47% | – | – | – | 3% |
| Public Policy Polling/Texas Democrats Archived October 14, 2020, at the Wayback Machine[A] | Oct 7–8, 2020 | 721 (LV) | ± 3.6% | 48% | 48% | – | – | – | 1% |
| YouGov/CCES Archived November 1, 2020, at the Wayback Machine | Sep 29 – Oct 7, 2020 | 2,947 (LV) | – | 49% | 47% | – | – | – | – |
| Morning Consult | Sep 28 – Oct 7, 2020 | ~2,700 (LV) | ± 2% | 49% | 46% | – | – | – | – |
| Pulse Opinion Research/Rasmussen Reports/Crosswind PR | Oct 5–6, 2020 | 1,000 (LV) | ± 3% | 51% | 44% | – | – | – | – |
| Civiqs/Daily Kos | Oct 3–6, 2020 | 895 (LV) | ± 3.4% | 48% | 48% | – | – | 2%[f] | 1% |
| Data For Progress (D) | Sep 30 – Oct 5, 2020 | 1,949 (LV) | ± 2.2% | 45% | 47% | 2% | 1% | – | 5% |
| YouGov/University of Texas/Texas Tribune | Sep 25 – Oct 4, 2020 | 908 (LV) | ± 3.25% | 50% | 45% | 2% | 2% | 1%[n] | – |
| EMC Research/Blue Texas PAC[B] | Sep 27 – Oct 2, 2020 | 848 (LV) | – | 49% | 49% | – | – | – | – |
| SurveyMonkey/Axios | Sep 1–30, 2020 | 13,395 (LV) | – | 52% | 46% | – | – | – | 2% |
| Hart Research Associates/Human Rights Campaign[C] | Sep 24–27, 2020 | 400 (LV) | ± 4.9% | 49% | 47% | – | – | – | – |
| Morning Consult | Sep 18–27, 2020 | ~2,700 (LV) | ± 2% | 48% | 47% | – | – | – | – |
| Public Policy Polling/Texas Democrats[2] Archived October 8, 2020, at the Wayback Machine[D] | Sep 25–26, 2020 | 612 (LV) | ± 3.6% | 48% | 48% | – | – | – | 4% |
| YouGov/UMass Lowell | Sep 18–25, 2020 | 882 (LV) | ± 4.3% | 49%[o] | 46% | 2% | 1% | 1%[p] | 1% |
| 50%[q] | 46% | – | – | 2%[r] | 2% | ||||
| Data For Progress[E] | Sep 18–22, 2020 | 726 (LV) | ± 3.6% | 47% | 45% | – | – | – | 9% |
| Siena College/NYT Upshot | Sep 16–22, 2020 | 653 (LV) | ± 4.3% | 46% | 43% | 1% | 1% | 0%[s] | 9%[l] |
| Quinnipiac University | Sep 17–21, 2020 | 1,078 (LV) | ± 3% | 50% | 45% | – | – | No voters | 4% |
| YouGov/CBS | Sep 15–18, 2020 | 1,129 (LV) | ± 3.5% | 48% | 46% | – | – | 2%[t] | 4% |
| Morning Consult | Sep 8–17, 2020 | ~2,700 (LV) | ± 2% | 47% | 47% | – | – | – | – |
| Morning Consult | Aug 29 – Sep 7, 2020 | 2,829 (LV) | ± 2% | 46%[u] | 46% | – | – | – | – |
| Public Policy Polling/Giffords[F] | Sep 1–2, 2020 | 743 (V) | – | 48% | 47% | – | – | – | 5% |
| University of Texas at Tyler/Dallas Morning News | Aug 28 – Sep 2, 2020 | 901 (LV) | ± 3.26% | 49%[e] | 47% | 1% | 1% | 1% | – |
| SurveyMonkey/Axios | Aug 1–31, 2020 | 12,607 (LV) | – | 52% | 46% | – | – | – | 2% |
| Morning Consult | Aug 21–30, 2020 | 2,632 (LV) | ± 2% | 48%[u] | 47% | – | – | – | – |
| Tyson Group/Consumer Energy Alliance[G] | Aug 20–25, 2020 | 906 (LV) | ± 3% | 44% | 48% | 0% | – | 0%[v] | 5% |
| Data for Progress/Texas Youth Power Alliance | Aug 20–25, 2020 | 2,295 (LV) | ± 2.0% | 45% | 48% | – | – | – | 8% |
| Public Policy Polling/Texas Democrats[3][H] | Aug 21–22, 2020 | 764 (RV) | ± 3.6% | 47% | 48% | – | – | – | 5% |
| Morning Consult | Aug 13–22, 2020 | ~2,700 (LV) | ± 2% | 48% | 47% | – | – | – | – |
| Morning Consult | Aug 7–16, 2020 | 2,559 (LV) | ± 2% | 47%[w] | 46% | – | – | – | – |
| Global Strategy Group/Chrysta for Texas[I] | Aug 11–13, 2020 | 700 (LV) | ± 3.7% | 45% | 47% | – | – | – | – |
| YouGov/Texas Hispanic Policy Foundation/Rice University's Baker Institute | Aug 4–13, 2020 | 846 (RV) | – | 48% | 41% | 1% | 1% | – | 10.2% |
| – (LV)[J] | 50% | 44% | 1% | 0% | – | 5% | |||
| Trafalgar Group (R) | Aug 1–5, 2020 | 1,015 (LV) | ± 3.0% | 49% | 43% | 2% | – | 2%[x] | 3% |
| Morning Consult | Aug 3–12, 2020 | ~2,700 (LV) | ± 2.0% | 47% | 46% | – | – | – | – |
| Morning Consult | Jul 24 – Aug 2, 2020 | 2,576 (LV) | ± 2.0% | 46%[u] | 47% | – | – | 2%[f] | 5% |
| SurveyMonkey/Axios | Jul 1–31, 2020 | 13,721 (LV) | – | 52% | 46% | – | – | – | 2% |
| Morning Consult | Jul 17–26, 2020 | 2,685 (LV) | ± 1.9% | 45%[w] | 47% | – | – | – | – |
| Morning Consult[4] | Jul 16–25, 2020 | ~2,700 (LV)[y] | ± 2.0% | 45% | 47% | – | – | – | – |
| Spry Strategies/American Principles Project[K] | Jul 16–20, 2020 | 750 (LV) | ± 3.5% | 49% | 45% | – | – | – | 6% |
| Quinnipiac University | Jul 16–20, 2020 | 880 (RV) | ± 3.3% | 44% | 45% | – | – | 7%[z] | 4% |
| Morning Consult | Jul 6–15, 2020 | – (LV)[y] | – | 46% | 46% | – | – | – | – |
| YouGov/CBS | Jul 7–10, 2020 | 1,185 (LV) | ± 3.6% | 46% | 45% | – | – | 4%[aa] | 6% |
| Gravis Marketing/OANN | Jul 7, 2020 | 591 (LV) | ± 4.3% | 46% | 44% | – | – | – | – |
| Dallas Morning News/University of Texas at Tyler | Jun 29 – Jul 7, 2020 | 1,677 (LV) | ± 2.4% | 43% | 48% | – | – | 4% | 5% |
| Morning Consult | Jun 26 – Jul 5, 2020 | – (LV)[y] | – | 46% | 45% | – | – | – | – |
| SurveyMonkey/Axios | Jun 8–30, 2020 | 6,669 (LV) | – | 51% | 46% | – | – | – | 2% |
| YouGov/University of Texas/Texas Politics Project | Jun 19–29, 2020 | 1,200 (RV) | ± 2.89% | 48% | 44% | – | – | – | 8% |
| Public Policy Polling[5] | Jun 24–25, 2020 | 729 (RV) | ± 3.6% | 46% | 48% | – | – | – | 5% |
| Morning Consult | Jun 16–25, 2020 | – (LV)[y] | – | 47% | 44% | – | – | – | – |
| Fox News | Jun 20–23, 2020 | 1,001 (RV) | ± 3% | 44% | 45% | – | – | 5%[ab] | 5% |
| Public Policy Polling/Progress Texas[6][L] | Jun 18–19, 2020 | 907 (V) | ± 3% | 48% | 46% | – | – | – | 6% |
| Morning Consult | Jun 6–15, 2020 | – (LV)[y] | – | 48% | 45% | – | – | – | – |
| Morning Consult | May 27 – Jun 5, 2020 | – (LV)[y] | – | 48% | 43% | – | – | – | – |
| Public Policy Polling/Texas Democrats Archived June 5, 2020, at the Wayback Machine[M] | Jun 2–3, 2020 | 683 (V) | – | 48% | 48% | – | – | – | 4% |
| Quinnipiac | May 28 – Jun 1, 2020 | 1,166 (RV) | ± 2.9% | 44% | 43% | – | – | 6%[ac] | 7% |
| Morning Consult | May 17–26, 2020 | 2,551 (LV) | – | 50%[u] | 43% | – | – | – | – |
| Morning Consult | May 16–25, 2020 | – (LV)[y] | – | 50% | 42% | – | – | – | – |
| Morning Consult | May 6–15, 2020 | – (LV)[y] | – | 49% | 43% | – | – | – | – |
| Emerson College | May 8–10, 2020 | 800 (RV) | ± 3.4% | 52%[ad] | 48% | – | – | – | – |
| Public Policy Polling | Apr 27–28, 2020 | 1,032 (V) | – | 46% | 47% | – | – | – | 7% |
| Dallas Morning News/University of Texas at Tyler | Apr 18–27, 2020 | 1,183 (RV) | ± 2.85% | 43% | 43% | – | – | 5% | 9% |
| University of Texas/Texas Tribune | Apr 10–19, 2020 | 1,200 (RV) | ± 2.8% | 49% | 44% | – | – | – | 7% |
| AtlasIntel | Feb 24 – Mar 2, 2020 | 1,100 (RV) | ± 3.0% | 47% | 43% | – | – | 11% | – |
| NBC News/Marist College | Feb 23–27, 2020 | 2,409 (RV) | ± 2.5% | 49% | 45% | – | – | 1% | 5% |
| CNN/SSRS | Feb 22–26, 2020 | 1,003 (RV) | ± 3.4% | 47% | 48% | – | – | 3%[ae] | 2% |
| Univision | Feb 21–26, 2020 | 1,004 (RV) | ± 3.1% | 43% | 46% | – | – | – | 11% |
| Dallas Morning News/University of Texas at Tyler | Feb 17–26, 2020 | 1,221 (RV) | ± 2.8% | 45% | 44% | – | – | 11% | – |
| YouGov/University of Texas/Texas Tribune | Jan 31 – Feb 9, 2020 | 1,200 (RV) | ± 2.83% | 47% | 44% | – | – | – | 10% |
| University of Texas at Tyler/Dallas News Archived February 2, 2020, at the Wayback Machine | Jan 21–30, 2020 | 910 (LV) | ± 3.24% | 46% | 44% | – | – | 10%[af] | – |
| Data For Progress[N] | Jan 16–21, 2020 | 1,486 (LV) | – | 54% | 40% | – | – | 3%[ag] | 3% |
| Texas Lyceum | Jan 10–19, 2020 | 520 (LV) | ± 4.3% | 51% | 46% | – | – | – | 3% |
| CNN/SSRS | Dec 4–9, 2019 | 1,003 (RV) | – | 48% | 47% | – | – | 2%[ah] | 3% |
| Beacon Research (R) | Nov 9–21, 2019 | 1,601 (RV) | ± 3.0% | 45% | 44% | – | – | – | – |
| University of Texas at Tyler | Nov 5–14, 2019 | 1,093 (RV) | ± 3.0% | 45% | 39% | – | – | – | 16% |
| University of Texas/ Texas Tribune | Oct 18–27, 2019 | 1,200 (RV) | ± 2.8% | 46% | 39% | – | – | 9%[ai] | 6% |
| University of Texas at Tyler | Sep 13–15, 2019 | 1,199 (RV) | ± 2.8% | 38% | 40% | – | – | 13% | 9% |
| Univision | Aug 31 – Sep 6, 2019 | 1,004 (RV) | – | 43% | 47% | – | – | – | 10% |
| Climate Nexus | Aug 20–25, 2019 | 1,660 (RV) | ± 2.4% | 43% | 43% | – | – | – | 9% |
| University of Texas at Tyler | Aug 1–4, 2019 | 1,261 (RV) | ± 2.8% | 37% | 41% | – | – | 14% | 8% |
| Emerson | Aug 1–3, 2019 | 1,033 (RV) | ± 3.0% | 49% | 51% | – | – | – | – |
| University of Texas at Tyler | Jul 24–27, 2019 | 1,414 (RV) | ± 2.6% | 37% | 37% | – | – | 12% | 14% |
| Quinnipiac University | May 29 – Jun 4, 2019 | 1,159 (RV) | ± 3.4% | 44% | 48% | – | – | 1% | 4% |
| WPA Intelligence | Apr 27–30, 2019 | 200 (LV) | ± 6.9% | 49% | 42% | – | – | – | 7% |
| Emerson College Archived July 3, 2019, at the Wayback Machine | Apr 25–28, 2019 | 799 (RV) | ± 3.4% | 50%[ad] | 51% | – | – | – | – |
| Quinnipiac University | Feb 20–25, 2019 | 1,222 (RV) | ± 3.4% | 47% | 46% | – | – | 1% | 5% |
| Public Policy Polling (D)[O] | Feb 13–14, 2019 | 743 (RV) | ± 3.6% | 49% | 46% | – | – | – | 5% |
New Mexico notes[edit]
- 2016 United States presidential election in New Mexico: Percentages 2016: Trump 40.04, Clinton 48.26
- US Percentages 2016: Trump 46.1%, Clinton 48.2%
- Nationwide opinion polling for the 2020 United States presidential election: Trump 45.1%, Biden 54.9%
Graphical summary[edit]
| Graphs are unavailable due to technical issues. There is more info on Phabricator and on MediaWiki.org. |
Aggregate polls[edit]
| Source of poll aggregation |
Dates administered |
Dates updated |
Joe Biden Democratic |
Donald Trump Republican |
Other/ Undecided [a] |
Margin |
|---|---|---|---|---|---|---|
| 270 to Win | October 6 – November 1, 2020 | November 3, 2020 | 53.5% | 40.5% | 6.0% | Biden +13.0 |
| FiveThirtyEight | until November 2, 2020 | November 3, 2020 | 53.8% | 42.3% | 3.9% | Biden +11.5 |
| Average | 53.7% | 41.4% | 4.9% | Biden +12.3 | ||
Polls[edit]
| Poll source | Date(s) administered |
Sample size[aj] |
Margin of error |
Donald Trump Republican |
Joe Biden Democratic |
Jo Jorgensen Libertarian |
Howie Hawkins Green |
Other | Undecided |
|---|---|---|---|---|---|---|---|---|---|
| SurveyMonkey/Axios | Oct 20 – Nov 2, 2020 | 1,481 (LV) | ± 3.5% | 42%[ak] | 56% | – | – | – | – |
| Research & Polling Inc./Albuquerque Journal | Oct 23–29, 2020 | 1,180 (LV) | ± 2.9% | 42% | 54% | – | – | 3%[al] | 1% |
| SurveyMonkey/Axios | Oct 1–28, 2020 | 2,719 (LV) | – | 46% | 52% | – | – | – | – |
| GBAO Strategies/Ben Ray Luján (D)[P] | Oct 14–17, 2020 | 600 (LV) | ± 4.0% | 41% | 54% | – | – | – | – |
| Public Policy Polling/NM Political Report | Sep 30 – Oct 1, 2020 | 886 (LV) | ± 3.3% | 39% | 53% | 2% | – | 2%[am] | 4% |
| SurveyMonkey/Axios | Sep 1–30, 2020 | 1,015 (LV) | – | 44% | 54% | – | – | – | 1% |
| Research & Polling Inc./Albuquerque Journal | Aug 26 – Sep 2, 2020 | 1,123 (LV) | ± 2.9% | 39% | 54% | – | – | – | – |
| SurveyMonkey/Axios | Aug 1–31, 2020 | 1,087 (LV) | – | 43% | 56% | – | – | – | 2% |
| SurveyMonkey/Axios | Jul 1–31, 2020 | 904 (LV) | – | 48% | 49% | – | – | – | 2% |
| SurveyMonkey/Axios | Jun 8–30, 2020 | 506 (LV) | – | 50% | 49% | – | – | – | 1% |
| Public Policy Polling/NM Political Report | Jun 12–13, 2020 | 740 (V) | ± 3.6% | 39% | 53% | – | – | – | 8% |
| Public Policy Polling/The Majority Institute Archived April 25, 2020, at the Wayback Machine[Q] | Apr 20–21, 2020 | 1,091 (RV) | ± 3.1% | 40% | 52% | – | – | – | – |
| Emerson College | Jan 3–6, 2020 | 967 (RV) | ± 3.1% | 46% | 54% | – | – | – | – |
Nevada notes[edit]
- 2016 United States presidential election in Nevada: Percentages 2016: Trump 45.50, Clinton 47.92
- US Percentages 2016: Trump 46.1%, Clinton 48.2%
- Nationwide opinion polling for the 2020 United States presidential election: Trump 45.1%, Biden 54.9%
Graphical summary[edit]
| Graphs are unavailable due to technical issues. There is more info on Phabricator and on MediaWiki.org. |
Aggregate polls[edit]
| Source of poll aggregation |
Dates administered |
Dates updated |
Joe Biden Democratic |
Donald Trump Republican |
Other/ Undecided [a] |
Margin |
|---|---|---|---|---|---|---|
| 270 to Win | October 16–31, 2020 | November 1, 2020 | 49.4% | 44.4% | 6.2% | Biden +5.0 |
| Real Clear Politics | October 23 – November 2, 2020 | November 1, 2020 | 48.7% | 46.3% | 5.0% | Biden +2.4 |
| FiveThirtyEight | until November 2, 2020 | November 3, 2020 | 49.7% | 44.4% | 5.9% | Biden +5.3 |
| Average | 49.3% | 45.0% | 5.7% | Biden +4.3 | ||
Polls[edit]
| Poll source | Date(s) administered |
Sample size[aj] |
Margin of error |
Donald Trump Republican |
Joe Biden Democratic |
Jo Jorgensen Libertarian |
Other | Undecided |
|---|---|---|---|---|---|---|---|---|
| Trafalgar Group | Oct 31 – Nov 2, 2020 | 1,024 (LV) | ± 2.98% | 49% | 48% | 1% | 1%[n] | 1% |
| SurveyMonkey/Axios | Oct 20 – Nov 2, 2020 | 2,366 (LV) | ± 3% | 49%[an] | 49% | - | – | – |
| Data for Progress | Oct 27 – Nov 1, 2020 | 1,442 (LV) | ± 2.6% | 44% | 51% | 3% | 2%[ao] | – |
| Emerson College | Oct 29–31, 2020 | 720 (LV) | ± 3.6% | 47% | 49% | - | 4%[ap] | – |
| Trafalgar Group | Oct 28–29, 2020 | 1,024 (LV) | ± 2.98% | 47% | 49% | 2% | 1%[n] | 1% |
| Gravis Marketing | Oct 27–28, 2020 | 688 (LV) | ± 3.7% | 44% | 50% | – | – | 6% |
| SurveyMonkey/Axios | Oct 1–28, 2020 | 3,333 (LV) | – | 49% | 50% | - | – | – |
| Siena College/NYT Upshot | Oct 23–26, 2020 | 809 (LV) | ± 3.8% | 43% | 49% | 3% | 2%[aq] | 4%[ar] |
| BUSR/University of Nevada | Oct 16–21, Oct 23, 2020 |
809 (LV) | ± 4% | 41% | 50% | – | – | – |
| Civiqs/Daily Kos | Oct 17–20, 2020 | 712 (LV) | ± 5.3% | 43% | 52% | - | 3%[as] | 1% |
| WPA Intelligence/Las Vegas Review-Journal/AARP | Oct 7–11, 2020 | 512 (LV) | ± 4.4% | 42% | 44% | 3% | 5%[at] | 6% |
| YouGov/CBS | Oct 6–9, 2020 | 1,036 (LV) | ± 4.1% | 46% | 52% | - | 2%[au] | 0% |
| Siena College/NYT Upshot | Oct 2–6, 2020 | 660 (LV) | ± 4.3% | 42% | 48% | 3% | 1%[av] | 6%[ar] |
| SurveyMonkey/Axios | Sep 1–30, 2020 | 1,239 (LV) | – | 47% | 51% | - | - | 2% |
| Pulse Opinion Research/Rasmussen Reports/American Greatness PAC[R] | Sep 23–25, 2020 | 750 (LV) | – | 48% | 49% | - | 2%[aw] | 1% |
| Qualtrics/University of Nevada/BUSR | Sep 10–25, 2020 | 641 (LV) | ± 4% | 41% | 46% | - | 7%[ax] | 6% |
| Fox News | Sep 20–23, 2020 | 810 (LV) | ± 3% | 41% | 52% | 3% | 2%[ay] | 2% |
| 911 (RV) | ± 3% | 40% | 50% | 3% | 3%[az] | 4% | ||
| ALG Research/The Nevada Independent (D)[S] | Sep 15–21, 2020 | 800 (LV) | ± 3.5% | 43% | 47% | – | – | – |
| Siena College/NYT Upshot | Sep 8–10, 2020 | 462 (LV) | ± 5.3% | 42% | 46% | 3% | 1%[ba] | 7%[ar] |
| SurveyMonkey/Axios | Aug 1–31, 2020 | 998 (LV) | – | 49% | 50% | - | – | 1% |
| Qualtrics/University of Nevada/BUSR | Aug 20–30, 2020 | 682 (LV) | ± 4% | 39% | 44% | – | 5%[bb] | 12% |
| SurveyMonkey/Axios | Jul 1–31, 2020 | 1,021 (LV) | – | 52% | 47% | - | - | 2% |
| SurveyMonkey/Axios | Jun 8–30, 2020 | 609 (LV) | – | 49% | 50% | - | - | 1% |
| ALG Research/The Nevada Independent (D)[T] | Apr 27–30, 2020 | 763 (LV) | ± 3.6% | 45% | 49% | – | – | – |
| AtlasIntel | Feb 19–21, 2020 | 1,100 (RV) | ± 3.0% | 41% | 44% | – | 15% | – |
| FOX News | Jan 5–8, 2020 | 1,505 (RV) | ± 2.5% | 39% | 47% | – | 9%[bc] | 4% |
| FOX News | Nov 10–13, 2019 | 1,506 (RV) | ± 2.5% | 40% | 47% | – | 9%[bc] | 4% |
| Emerson College | Oct 31 – Nov 2, 2019 | 1,089 (RV) | ± 2.9% | 51% | 49% | – | – | – |
| Gravis Marketing | Aug 14–16, 2019 | 926 (RV) | ± 3.2% | 43% | 49% | – | – | 8% |
| Emerson College Archived April 20, 2019, at the Wayback Machine | Mar 28–30, 2019 | 719 (RV) | ± 3.6% | 48% | 52% | – | – | – |
Fairly Solid Republican States[edit]
- Alaska (R Lead 2016 14.7) now at 1/6 for R
- Arkansas (R Lead 2016 26.9) now at 1/33 for R
- Indiana R Lead 2016 19.0) now at 1/33 for R
- Utah R Lead 2016 c. 25) now at 1/25 for R
Forthcoming[edit]
- Unibet
- https://www.unibet.co.uk/betting/sports/drill-down/politics (United Kingdom, Australia, Denmark, European Union, France, Germany, Norway, Sweden)
- 31 Oct 2020: 2020 Queensland state election
- 3 Nov 2020: US presidential election
- 3 Nov 2020: US Senate & HoR elections
- 13 Mar 2021: West Australia Election
- 13 Sep 2021: Norwegian General Election
- 1 Oct 2021: German Federal Election
- 18 Mar 2022: South Australia State Election
- 7 May 2022: French Presidential Election
- 1 Sep 2022: Swedish General Election
- 26 Nov 2022: Victoria State Election
- 1 Jan 2023: Danish General Election
- 1 December 2024: UK general election
- PP
- https://www.paddypower.com/politics
- 15 & 29 November 2020: 2020 Rio de Janeiro mayoral election (Eduardo Paes 1/7)
- 6 May 2021: 2021 London mayoral election (Khan 1/5)
- 6 May 2021: 2021 Welsh Assembly Elections - Most Seats (2021 Senedd election) (Labour 3/10)
- Next German Chancellor after Angela Merkel (see 2021 Christian Democratic Union of Germany leadership election, odds as at 8 Nov 2020)
- Friedrich Merz (CDU, 1955) 7/4
- Markus Söder (CSU, 1967) 11/4
- Armin Laschet (CDU, 1961) 7/2
- Robert Habeck (Alliance 90/Greens, 1969) 4/1
- Norbert Röttgen (CDU, 1965) 12/1
- Daniel Günther (CDU, 1973) 25/1
- Alice Weidel (AfD, 1979) 25/1
- Ralph Brinkhaus (CDU, 1968) 25/1
- Julia Klöckner (CDU, 1972) 33/1
- Wolfgang Schäuble (CDU, 1942) 33/1
- Peter Altmaier (CDU, 1958) 40/1
- Ursula von der Leyen (CDU, 1958), 50/1
- Martin Sonneborn (Die PARTEI, 1965), 50/1
Cite error: There are <ref group=lower-alpha> tags or {{efn}} templates on this page, but the references will not show without a {{reflist|group=lower-alpha}} template or {{notelist}} template (see the help page).
Cite error: There are <ref group=upper-alpha> tags or {{efn-ua}} templates on this page, but the references will not show without a {{reflist|group=upper-alpha}} template or {{notelist-ua}} template (see the help page).