
Talk:Timeline of the COVID-19 pandemic in January 2020/Archive 2
| This is an archive of past discussions. Do not edit the contents of this page. If you wish to start a new discussion or revive an old one, please do so on the current talk page. |
| Archive 1 | Archive 2 |
2019-02-07: Proposal for mortality graph with under-estimator curve, over-estimator curve, and early data
In the intitial phase of an epidemic, D/(D+R) is a known over-estimator, and D/C is a known under-estimator. See for example, https://medicalsciences.stackexchange.com/questions/21001/what-is-a-sophisticated-estimate-of-the-2019-ncov-fatality-rate . As is suggested in that link, I suggest a timecourse graph be added to the page. The graph would show the timecourse curves for the estimators D/C and D/(D+R), as well as annotated individual data points, such as (x,y) = (Jan 22, 18%) (that data point is for the first 41 cases as of Jan 22nd as detailed in the Jan 24th case-review paper in The Lancet) SailBelow (talk) 18:57, 7 February 2020 (UTC)
- Dear @SailBelow:, I have generated some data that "simulates" an ongoing outbreak with a given death/recovery probability and the possibility to include a different time delay between case -> death and case -> recovery. With this data, I made a timecourse of both D/C and D/(D+R). The usefulness of one vs. the other is quite obvious. I will try to provide the graphs here as soon as possible.TheRightKindOfDoctor (talk) 20:40, 7 February 2020 (UTC)
- @TheRightKindOfDoctor:, Awesome, looking forward to it !
- @TheRightKindOfDoctor: I also look forward to you publishing the graphs. I don't know how to make the graphs update automatically with the numbers. I would suggest graphs for D/(D+R), Daily Increase in Confirmed, and Total Resolved/Confirmed (Resolved = D+R).--AAAAA (talk) 14:18, 8 February 2020 (UTC)

@SailBelow: Data was generated using the error function (erf), a 20% probability of death and a time delay for recovery compared to death (these parameter values were chosen to make the different plots easy to visualise - as opposed to a more realistic 2% probability of death).
- Left plot: stacked graphs of deaths, ill and recovered (very similar to https://en.wikipedia.org/wiki/2015_Middle_East_respiratory_syndrome_outbreak_in_South_Korea#/media/File:2015_MERS_Cases_in_South_Korea.svg where the envelope of the graph is equal to the total cumulated cases).
- Right plot: timecourse of both CFR (D/C) and D/(D+R) computed from the synthetic data: which do you prefer ;-) ? TheRightKindOfDoctor (talk) 13:49, 8 February 2020 (UTC)
- @TheRightKindOfDoctor: You mentioned "The usefulness of one vs. the other is quite obvious". And "a more realistic 2% probability of death". I believe that D/(D+R) will asymptotically converge to the real (final) CFR, while D/C will be greatly affected by the daily increase. If the daily increase is high and the days to resolution is high, D/C will be "depressed" until the daily increase is substantially reduced. This means that for a long time it could show a very low number. Your graph doesn't show that. In your graph the D/C rises slightly at the beginning and stays stable until the end. That's not what happens when you have a high daily increase in confirmed cases a long time from diagnosis to resolution. I will try to work on a graph later, using 10% average daily increase and 15 days average time from diagnosis to resolution--AAAAA (talk) 14:30, 8 February 2020 (UTC)

- The graph on the right is a simulation using the following parameters: 40 Initial Confirmed, 65% Initial Daily Increase in Confirmed Cases (Increase on 2nd day from fist day), 7% Daily Reduction in the Daily Increase Rate, 10% Real CFR (constant), 10 Average Days to Death from time of Diagnosis, 20 Average Days to Recovery from time of Diagnosis. You can see that the D/C (Deaths/Confirmed), wrongly called CFR while the outbreak is not finished, keeps going up over time until it converges with D/(D+R) unlike the plot created by User:TheRightKindOfDoctor, which seems to stabilize pretty quickly, and doesn't seem right.--AAAAA (talk) 18:41, 8 February 2020 (UTC)
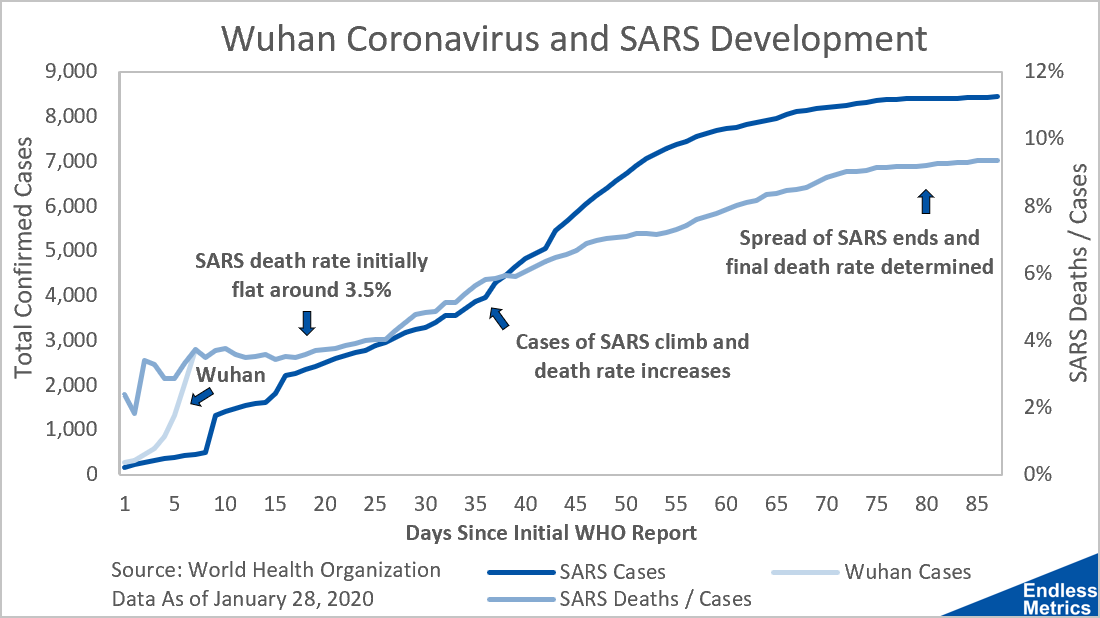
- Look at the evolution of D/C in the SARS cases The D/C was "stable" for some time... and then... surprise!... started to climb and ended up 3 times higher than originally thought. Same thing will most likely happen with this outbreak. At some point it will start to climb steadily and then converge with the D/(D+R). Based on current numbers, seems that something over 6%. I initially thought it would be between 8-15% but numbers now seem to indicate that the final CFR will be around 6% --AAAAA (talk) 20:31, 8 February 2020 (UTC)
- I've seen that figure, which seems to be sourced to someone's blog. I've also seen this figure [1] which appeared in the Canadian Medical Association Journal and gives a very different impression. Dragons flight (talk) 23:39, 8 February 2020 (UTC)

- @AAAAA:. Hello again ... So what do we have here ? D/C vs. D/(D+R) graphs. What does mine and yours have in common despite the different initial "simulation" parameters ? They both show that D/(D+C) is a "lazy" indicator that spends almost half of the outbreak with values that are between 10 and 70 points above the ab initio parameter (10% in your case, 20% in mine). What seems right or not to you is irrelevant when all one needs is to look at the current data D/C vs. D/(D+R) graph: same conclusion ! TheRightKindOfDoctor (talk) 22:56, 8 February 2020 (UTC)
- @TheRightKindOfDoctor: I have a question for you: Based on the current data available, what do you estimate (or guesstimate) that the final CFR will be? Do you really think that the finaly CFR will be about 2%, the same as it is now? --AAAAA (talk) 23:52, 8 February 2020 (UTC)
- @AAAAA:. I'm a scientist. Scientists typically work to improve measurements / data collection. Why would anyone waste their time "guesstimating" when there are many real-life things that can alter the course of this outbreak, like mutations or a treatment (that would change the progression of CFR) or a bias in the data from running out of diagnose kits, or from receiving much faster new "speed-tests" (that also would change the progression of CFR). CFR has been equal to approx. 2% +/-1 for some time now (2% is not low, 0.1 is). CFR when combined with the number of cases, is a reliable indicator of the severity of this outbreak. CFR is just a measure ... and that's it - it's time to accept that don't you think ? TheRightKindOfDoctor (talk) 00:58, 9 February 2020 (UTC)
- @AAAAA:. Hello again ... So what do we have here ? D/C vs. D/(D+R) graphs. What does mine and yours have in common despite the different initial "simulation" parameters ? They both show that D/(D+C) is a "lazy" indicator that spends almost half of the outbreak with values that are between 10 and 70 points above the ab initio parameter (10% in your case, 20% in mine). What seems right or not to you is irrelevant when all one needs is to look at the current data D/C vs. D/(D+R) graph: same conclusion ! TheRightKindOfDoctor (talk) 22:56, 8 February 2020 (UTC)

- For illustration purposes, I used 50% final CFR in the simulation. Please look at how similar it looks compared to the SARS CFR chart Also, you can notice that if final CFR was 50%, the under-estimator and over-estimator curves have similar degrees of "lazyness".--AAAAA (talk) 00:14, 9 February 2020 (UTC)
- @AAAAA:. 50 % !!! Nice try but the SARS exemple you provide shows a CFR equal to approx. 3.5% that goes up 6 points in 2.5 months ... that's almost nothing compared to how much D/(D+R) changes in a few days. TheRightKindOfDoctor (talk) 00:58, 9 February 2020 (UTC)
- @TheRightKindOfDoctor: Seems you misunderstood me. I didn't put 50% because I think that the final CFR of this outbreak is anything near that number. It was for illustration purposes. To show that the D/C curve has the same "look" of the D/(D+R) curve, and it's not almost straight as it seems to be in your simulation plot. Once more... I am not saying that D/(D+R) is anything near the final CFR. But it serves to show that D/C isn't the final CFR either. I found an interesting article in worldometer. It references an article in the American Academy of Epidemiology titled "Methods for Estimating the Case Fatality Ratio for a Novel, Emerging Infectious Disease". This article states "But while an epidemic is still ongoing, as it is the case with the current novel coronavirus outbreak, this formula (CFR=Deaths/Cases) is, at the very least, "naïve" and can be "misleading if, at the time of analysis, the outcome is unknown for a non negligible proportion of patients" --AAAAA (talk) 02:41, 9 February 2020 (UTC)
- @AAAAA:. I understand quite well, don't worry. I don't have time right now but ... spoiler alert: the worldometers bit about CFR is using specious arguments. For the AJOE article, I need more data and a bit of time to verify some stuff (that's the other thing scientists do: they double check everything they need to ;-). TheRightKindOfDoctor (talk) 19:31, 9 February 2020 (UTC)
- @AAAAA:. Concerning the article in worldometer, it's a bit of a mixed bag of "good and not so good" statements. For example: (1) After explaining correctly why, during an outbrake, D/C is a "naïve" estimate of the CFR, it goes on to introduce CFR = deaths at day.x / cases at day.x-{T} (where T = average time period from case confirmation to death) and provides examples for T=7 and T=12 ... but forgets to mention that for T greater than 8, this method of calculation will give values of CFR above 100% ... oops ! (2) After explaining that CFR would be better estimated if calculated as deaths/(deaths + recovered) because D/C is just "naïve and can be misleading" they get a CFR = 20% !!! Oh, no, what should we do ... quick, think of something ... I know, just take away 90% of all the data ... CFR=4.3% (...outside of mainland China): much better now, don't you think ? TheRightKindOfDoctor (talk) 12:59, 10 February 2020 (UTC)
About the case statistics section size, let's try to reduce the size of the templates used
See new discussion in Talk:Timeline_of_the_2019–20_Wuhan_coronavirus_outbreak_in_February_2020#About_the_case_statistics_section_size,_let's_try_to_reduce_the_size_of_the_templates_used robertsky (talk) 07:32, 11 February 2020 (UTC)
Requested move 11 February 2020
Timeline of the 2019–20 Wuhan coronavirus outbreak in December 2019 – January 2020 → Timeline of the COVID-19 outbreak in December 2019 – January 2020 – Virus has an official name by WHO 70.21.192.44 (talk) 21:57, 11 February 2020 (UTC)
- Comment This request move now resides in the 2019-nCoV talk page because this article will moved along with all articles retaining former names prior to WHO and ICTV announcement as COVID-19 and SARS-CoV 2. 36.76.229.147 (talk) 22:31, 11 February 2020 (UTC)
Move discussion in progress
There is a move discussion in progress on Talk:2019 novel coronavirus which affects this page. Please participate on that page and not in this talk page section. Thank you. —RMCD bot 23:48, 11 February 2020 (UTC)
Mortality rates and differences in timecourses for deaths and recoveries
@AAAAA @TheRightKindOfDoctor - Sorry I haven't been keeping up.
One issue with D/(D+R) is that there seems to be a rule of thumb (for diseases in general) that the average time between illness onset and death is much shorter than the average time between illness onset and recovery. Suppose average death is at day 7, and average recovery is at day 12 (both numbers are fictitious). The offset is 5 days.
So perhaps the D/(D+R) calculation ought to incorporate an offset. For example use D on day N, and use R on day N+offset. For 2019nCoV, the offset is unknown. Could be 10 days, 2 days, 0 days, or -4 days.
I propose this question: is there an offset which stabilizes D/(D+R) trend? Is there an offset that makes the trend a (more or less) flat line?
SailBelow (talk) 04:19, 12 February 2020 (UTC)
COVID-19 broke the Wiki - templates including {{reflist}} are not working right
With its templates, this page is so big that it exceeds the capabilities of the Wikimedia software.
Specifically, it's "Post-expand include size" is larger than 2MB, causing templates near the end of the page to not be expanded. This means references don't show up.
The most straightforward thing to do is to either reduce the number of templates that are used or to split the article. The most logical split would be by time.
For technical details, see the explaination at the top of Category:Pages where template include size is exceeded. davidwr/(talk)/(contribs) 06:57, 14 February 2020 (UTC)
- See Talk:Timeline of the 2019–20 Wuhan coronavirus outbreak in February 2020#About the case statistics section size, let's try to reduce the size of the templates used. I raised this up earlier. robertsky (talk) 07:19, 14 February 2020 (UTC)
- @Davidwr: Did an temporary fix to lower the post-expand include size. I am thinking of splitting the data templates by month as well. However I want to do some experiments first. robertsky (talk) 07:53, 14 February 2020 (UTC)
We should (re)move the table
A better way to show the number of cases would be a graph. The tables are huge and take up almost a full page. --Colin dm (talk) 16:36, 29 January 2020 (UTC)
- You removed the table that showed 5 metrics (suspected/confirmed/severe cases, deaths, recovered) and replaced it with a chart that just shows 1 metric (confirmed cases). You lost 4 metrics in the process. Unless you can add charts that show all 5 metrics, you should reinstate the table. Mbevand (talk) 18:18, 29 January 2020 (UTC)
- Unfortunately you seem to have removed the main chart without debate. Someone has obviously done a lot of work on creating and maintaining it. I would add that graphs are not necessarily a "better way"; some readers are more visual, while others feel more at home with organised statistics. I suggest that this change be reverted Theeurocrat (talk) 17:39, 29 January 2020 (UTC)
- I second this guy. I concede the table was ungainly, but the data itself was more meaningful than the chart by itself. talk) 12:49, 29 January 2020 (EDT) — Preceding unsigned comment added by 192.226.62.169 (talk)
- more specifically, please re-instate the table called "Case Chronology in Mainland China", last present [here](https://en.wikipedia.org/w/index.php?title=Timeline_of_the_2019%E2%80%9320_Wuhan_coronavirus_outbreak&direction=prev&oldid=938180946). Cordially yours, Lord Dinklebert von Stubbins, esq. — Preceding unsigned comment added by 192.226.62.169 (talk) 18:14, 29 January 2020 (UTC)
- I agree; I think the table makes it a lot easier to understand the growth of the outbreak and works much better than a chart. In addition, we should definitely make the viewing area more than 8 rows tall. I understand it must become limited at some point, but I don't think 8 is the right amount. I think 40 would look a lot more fitting, considering the aspect ratio of most screens. The size of them shouldn't really matter in my mind, as I think this article is more technical, and as such, should be more oriented to those doing intensive research, for whom taller tables would help a lot. --Jake M Blueshoes317 (talk) 02:04, 30 January 2020 (UTC)
The charts and table were the whole reason I kept checking this page daily. Please reinstate! Where else can I get the same data equally accessible? Henrik.levkowetz (talk) 18:02, 29 January 2020 (UTC)
- Sorry, clearly the community consensus on this matter was against me, so I'll reinstate the charts.--Colin dm (talk) 18:28, 29 January 2020 (UTC)
- No worries. To be clear, I think most people just care about this small table: https://imgur.com/a/GPw9383 We (at least I) don't care about the per-province data in the other larger tables. Mbevand (talk) 18:38, 29 January 2020 (UTC)
- Agreed re: provincial table. Those ones were a hot mess. Maybe if this thing continues to grow exponentially those tables will add more value. But for now the one you're revived ought to suffice. Thanks a ton, and don't forget to do the vampire sneeze! — Preceding unsigned comment added by 192.226.62.169 (talk) 18:51, 29 January 2020 (UTC)
- I plan to fish back these tables and put them into templates. 👍🏻 Yug (talk) 19:22, 29 January 2020 (UTC)
- Thank you for putting it back in - my question, the data was specific to China, is there anyway to expand the numbers in the table (even going forward) to be global numbers?Whaleyjosh (talk) 21:12, 29 January 2020 (UTC)
- Soft reminder... The table we here discussed and then removed were added via Revision 2020-01-29T07:48:12 and other edits, by user:Rethliopuks. When removing large edit-works, please remember to quickly identify via the article's history and notify the main author. While your rationals to remove these overly detailled tables are legit, Rethliopuks invested time and skills for the community. Remember to take 5~10 minutes to thanks the main autho, ask his/her input in the discussion. Politely and positively notify such helpful editors is healthy for all of us. Yug (talk) 21:24, 29 January 2020 (UTC)
- PS:
 Done, Rethliopuks data and formating has been fished back and moved to templates {{2019-20 Wuhan coronavirus data/China medical cases}}, {{2019-20 Wuhan coronavirus data/China medical cases by province}}, accessible via the root template {{2019-nCoV}}. Seems a good solution to save this valuable structured data ! :D Yug (talk) 21:44, 29 January 2020 (UTC)
- Thank you for putting it back in - my question, the data was specific to China, is there anyway to expand the numbers in the table (even going forward) to be global numbers?Whaleyjosh (talk) 21:12, 29 January 2020 (UTC)
- Provincial data are becoming more meaningful as the cases spread. It is really important to for many people to be able to understand how which parts of China are faring. In my mind I think of it like a EU by-country data table; yes, for a hypothetical epidemic in the EU, EU-wide numbers are probably the most helpful for non-EU citizens such as a Brazilian, considering the Schengen area and EU free movement of persons, but national data contain important information too. As another example, for the same 7000 cases, 6000 in Hubei and 650 in the surrounding provinces is very different from 4000 in Hubei and 2500 in Southeastern coastal provinces and the direct municipalities. Rethliopuks (talk) 02:11, 30 January 2020 (UTC)
- I plan to fish back these tables and put them into templates. 👍🏻 Yug (talk) 19:22, 29 January 2020 (UTC)
- Agreed re: provincial table. Those ones were a hot mess. Maybe if this thing continues to grow exponentially those tables will add more value. But for now the one you're revived ought to suffice. Thanks a ton, and don't forget to do the vampire sneeze! — Preceding unsigned comment added by 192.226.62.169 (talk) 18:51, 29 January 2020 (UTC)
I only came here to see the current table. A chart is __USELESS__. I'd like to see the numbers, in a table, like you removed. It's actually useful information, a chart is not at all useful. You've made this worthless by removing the tables and numbers. — Preceding unsigned comment added by 47.136.167.204 (talk) 18:34, 14 February 2020 (UTC)
Move discussion in progress
There is a move discussion in progress on Talk:2019–20 Wuhan coronavirus outbreak which affects this page. Please participate on that page and not in this talk page section. Thank you. —RMCD bot 22:04, 18 February 2020 (UTC)
Move discussion in progress
There is a move discussion in progress on Talk:2019–20 coronavirus outbreak which affects this page. Please participate on that page and not in this talk page section. Thank you. —RMCD bot 22:19, 18 February 2020 (UTC)
Numbers add up?
Read: 18 January. After the first 41 laboratory-confirmed cases on January 2 Chinese officials announced no new cases for the next 16 days, then reported 17 additional laboratory-confirmed cases. This brought the number of laboratory-confirmed cases in China to 62.
How come we have 41 added with 17 equals 62? 116.118.3.27 (talk) 04:37, 19 February 2020 (UTC)
WikiProject COVID-19
I've created WikiProject COVID-19 as a temporary or permanent WikiProject and invite editors to use this space for discussing ways to improve coverage of the ongoing 2019–20 coronavirus pandemic. Please bring your ideas to the project/talk page. Stay safe, ---Another Believer (Talk) 16:54, 15 March 2020 (UTC)
Chronology
- https://www.nationalreview.com/the-morning-jolt/chinas-devastating-lies/ SandyGeorgia (Talk) 19:28, 23 March 2020 (UTC)
Our timeline currently states, 26 December On 26 December 2019, a laboratory identified the coronavirus from the sample collected on 24 December as to be most closely related to a bat SARS-like coronavirus.[18]
Ref 18 takes me here [2], where I can see that a sample was taken on the 24th, but I am given no confirmation of when sequencing occurred. Additional information including sample accession number, author, and a title don't help, as there's no journal given and I can't find an article title by this name (if one is being referenced).
According to the New England Journal of Medicine [3], the Chinese CDC completed gene sequencing one week later, on 3 January 2020. The article also states that the CCDC announced a novel CoV as the cause of the outbreak on 8 January, and released the genome on 10 January.
Based on this information I'm removing our entry for 26 December, unless we can find sources demonstrating that something specific happened on this date. -Darouet (talk) 15:25, 26 March 2020 (UTC)
- Any interested editor can see my deletions here: [4] and [5]. -Darouet (talk) 15:32, 26 March 2020 (UTC)
- Darouet Interesting problem as discovering a new virus isn't as simple. The primary source is [6] which is the CDC paper explaining how they did. They got samples on 30 Dec, they did assays for common viruses that failed. Then they did a RT-PCR targeting a stable region of β-CoV, they obtained low but positive amplification, thus suggesting the cells were infected by a β-CoV. They did a culture of the virus by infecting lung cells with the sample, they found cytopathic effect, they looked at electronic microscope to see the crown like appearance. They mixed nanopore and illumina sequencing to obtain parts of the genome from which they could generate some primers to fill the gap with Sanger sequencing. From there they could place the virus into the phylogenetic tree of β-CoV (the closest Bat virus had 87% identity as they didn't know WIV's RaTG13 yet). The sequence was posted on Genbank on 13 Jan, in a Chinese database on Jan 5?, on a virological post on Jan 10, only one nucleotide was different from the final clean full-length sequence posted 10 days later. The 30 Dec some samples were also given to Wuhan institue of virology which did several confirmation and sequencing and serological assays.
That reference was reference 19 you clicked. 18 was a Caixin article [7] titled 独家|新冠病毒基因测序溯源:警报是何时拉响的 which does seem to support the assertions that you edited out. 2604:2D80:520D:5E00:31B9:E23A:DD5B:260F (talk) 22:37, 29 March 2020 (UTC)
- Hey, thanks for the tip. That reference [8] from Caixin does write that the bronchial lavage was sequenced just a couple days after sampling (translation follows):
On December 22, this patient's condition worsened and he entered the ICU, where doctors used various antibiotics to treat him ineffectively. Wuhan City Center Hospital respiratory medicine chief physician Professor Zhao Su told Caixin reporters, December 24, a deputy chief physician of the Department of Respiratory Medicine to this patient for bronchoscopic sampling, and then sent the patient's alveolar lavage fluid samples to a third-party testing institution Guangzhou Weizuan Genetic Technology Co... Generally, gene sequencing companies are supposed to feed back test results three days later, on December 27, but Microfar Gene did not give a written report. "They just called to inform us that it was a new coronavirus"... On February 21, 2020, the genetic testing information of this case was disclosed in an article on WeChat's "Weifeng Gene"... [According to the article] On December 27, the lab assembled the near-complete viral genome sequence, and the data were also shared with the Institute of Pathogenesis of the Chinese Academy of Medical Sciences. "It was basically confirmed that this patient's sample did indeed contain a novel virus similar to Bat SARS like coronavirus."
- I'm not sure how to handle translated Chinese news articles quoting from other Chinese sources, vs. scientific publications, but am open to suggestions. -Darouet (talk) 16:44, 1 April 2020 (UTC)
Visual Medicals or Vision Medicals?
The second referenced source ([9]) mentions the company as Vision Medicals
, not Visual Medicals
. --MarioGom (talk) 14:14, 8 April 2020 (UTC)
The first case of Covid-19
Using the China morning post as a source does not substantiate credible documentation. There is not a single reference to said case in Chinese record where they specifically state the first case was December 8, 2019. [1] Furthermore even the world entities such as the Lancet corroborate only the December 8, 2019 reference. [2] The claim of the case in November specifically bears its origin within a Chinese ministers Lijian Zhao attempt to put the blame on the USA and insinuate they brought the virus to China and parroted the same day in the China morning post. There is "Zero" recognized medical history by any world recognized entity for said case. Wikipedia needs to be a factual record not a propaganda page. Hardrocker11969 (talk) 13:47, 15 April 2020 (UTC) I want to add here for you all writing on this page that if you want to say something about November make it November 2017 when the Wuhan Institute on Virology was studying these same bats related to todays Corona virus and the specific genome that allows for person to person transmission. [3]
References
Late November: ABC News claims
Is this WP:DUEWEIGHT for the beginning of the timeline? A single report from an anonymous source that has been denied by the corresponding authority does not look appropriate to start the timeline about the pandemic:
According to anonymous US military sources quoted by ABC News in April 2020, a November intelligence report by the US military's National Center for Medical Intelligence (NCMI) "warn[ed] that a contagion was sweeping through China’s Wuhan region, changing the patterns of life and business and posing a threat to the population".[1] The authenticity of this claim has been called into question because no concrete date was provided for the alleged NCMI report. Asked about the November warning on ABC's This Week, Defense Secretary Mark Esper told Chief Anchor George Stephanopoulos: "I can't recall, George. But we have many people who watch this closely." On April 8, Colonel R. Shane Day, Director of the NCMI stated: "in the interest of transparency during this current public health crisis, we can confirm that media reporting about the existence/release of a National Center for Medical Intelligence Coronavirus-related product/assessment in November of 2019 is not correct. No such NCMI product exists."
--MarioGom (talk) 22:21, 15 April 2020 (UTC)
- MarioGom, debatable and ambiguous. This could have been referring to a strain of hantavirus in the region. A hantavirus-related death[2] was reported last month and may have sparked fears[3] of the plague resurfacing. —Tenryuu 🐲 ( 💬 • 📝 ) 01:16, 16 April 2020 (UTC)
References
- ^ News, A. B. C. "Intelligence report warned of coronavirus crisis as early as November: Sources". ABC News.
{{cite web}}:|last1=has generic name (help) - ^ "Man dies in China due to hantavirus amid COVID-19 pandemic". Canoe.com. 25 March 2020. Archived from the original on 28 March 2020. Retrieved 15 April 2020.
- ^ "One hantavirus death in China sparks 'hysteria' over old disease". Global News. 24 March 2020. Archived from the original on 15 April 2020. Retrieved 15 April 2020.
2nd December question
My Chinese language skill is not so good, but it would seem that the patient referred is described, in the article from January 4, as having 重症肺炎, severe acute pneumonia and not 新冠肺炎, covid-19. In the article from January 14 the diagnose is said to be 过敏性紫癜, Henoch–Schönlein_purpura, which is severe, but his condition is bettering. The storyline of the two Chinese articles evolve around an engaged doctor taken seriously ill and transferred to intensive care, consequencing a very huge medical bill. Also his father and his wife are doctors. 87.49.146.68 (talk) 07:56, 19 April 2020 (UTC)
Update: No results when searching both articles for 新冠肺炎 'covid-19', 新型冠状病毒 'new coronary virus' and 冠状 'coronary/crown-shaped' 87.49.146.68 (talk) 08:22, 19 April 2020 (UTC)
- Thank you for the explanation. I'm removing the section. Using a press source from 4 January to link a case to COVID-19 is speculation and original research, which is not allowed. If later reports are not talking about this case in relation to COVID-19, then it does not belong to this article. --MarioGom (talk) 08:40, 19 April 2020 (UTC)
Remove the Unnecessary, Targeted Trump Bias
Several quotes from President Trump are seeded throughout the timeline that serve only to cast a negative spin on the president; no other leader is treated this way. No other world leader leader is quoted with full sentences; but rather one, two, and three word snippets removed from all context. Even the W.H.O. mistakes and misstatements are omitted, and only positive statements are included.
There are several attributions of "United States government" where it is more accurate to use a "President Trump" attribution.
Tangentially, the entire timeline would benefit from being a dot-list outline instead of full prose; if this were done, the oddly slanted quotes would stand out plainly. — Preceding unsigned comment added by DeniedInformation (talk • contribs) 14:25, 21 April 2020 (UTC)
Another split proposal
With no opposition, a split will be shortly carried through.
- The following discussion is closed. Please do not modify it. Subsequent comments should be made on the appropriate discussion page. No further edits should be made to this discussion.
I think this article is getting rather crowded. It has recently reached 300KB in size with new information coming in at a fast rate. It is already 10 times the size of the average article, I don't think it's a good idea to keep expanding. I think it would be beneficial if the information present in the article be broken into two. I propose we split this article at the yar line and have two articles that cover the events of November/December and January respectively:
- Timeline of the 2019–20 coronavirus pandemic in January 2020
- Timeline of the 2019–20 coronavirus pandemic from November to December 2019
What do you guys think? --Diriector_Doc┝Talk
Contribs━━━┥ 19:06, 13 April 2020 (UTC)
- Diriector Doc, I support the split as you've proposed, but depending on how big the pages are afterwards if editors continue to contribute it might need to be split further. —Tenryuu 🐲 ( 💬 • 📝 ) 05:29, 15 April 2020 (UTC)
- Maybe. I think we need to trim first all unsourced stuff, dodgy sources, undue stuff, etc. And then evaluate the situation again. --MarioGom (talk) 20:33, 15 April 2020 (UTC)
- @MarioGom: I don't think we should trim the article per se, but instead, divvy up the information between a few related articles to narrow the focus. By the way, what are you considering "undue" if you don't mind me asking? --Diriector_Doc┝Talk
Contribs━━━┥ 22:53, 15 April 2020 (UTC)- Diriector_Doc: #Late November: ABC News claims or this, for example. --MarioGom (talk) 23:23, 15 April 2020 (UTC)
- Diriector_Doc: Anyway, I don't think we can get it under 280-300k. Your proposed split looks good to me. --MarioGom (talk) 23:27, 15 April 2020 (UTC)
- @MarioGom: I don't think we should trim the article per se, but instead, divvy up the information between a few related articles to narrow the focus. By the way, what are you considering "undue" if you don't mind me asking? --Diriector_Doc┝Talk
- A split seems reasonable. There is a lot more information on Nov-Dec'19. I'll try some more later. Whispyhistory (talk) 08:50, 17 April 2020 (UTC)
- Strong support: would improve readability and per WP:Article size. buidhe 08:14, 25 April 2020 (UTC)
Update
After over a week with no opposition, I took the liberty of starting two drafts of how the pages might look:
- Draft:Timeline of the 2019–20 coronavirus pandemic from November to December 2019
- Draft:Timeline of the 2019–20 coronavirus pandemic in January 2020
Let me know what you guys think. --Diriector_Doc┝Talk
Contribs━━━┥ 19:27, 21 April 2020 (UTC)
- Seems fine. I have just worked my way through 'Late November', for a rewrite, and planning edits for a couple more paragraphs. I'm tempted to make an excuse for posting arguments, but currently hold on to a bold edit in a day or two - just so you know. Sechinsic (talk) 21:49, 21 April 2020 (UTC)
Closure soon
This discussion has been open for a while now with no opposition. I'm going to leave it open for a few more days and if there are no further concerns, I will go ahead and implement the proposed split. --Diriector_Doc┝Talk
Contribs━━━┥ 01:12, 24 April 2020 (UTC)
- Diriector Doc, +1 to move on. It could make sense to create the January article and move the existing one, preserving history? --MarioGom (talk) 09:55, 25 April 2020 (UTC)
- The discussion above is closed. Please do not modify it. Subsequent comments should be made on the appropriate discussion page. No further edits should be made to this discussion.
Patient zero
The sources on the 17 november case are not trustful at all. ScmPost is not a reliable primary source on the epidemic, and the guardian source literally says "The data obtained by the Post, which the Guardian has not been able to verify [...]". For now what is reliable is that there is a (non-market) pneumonia on 1 Dec and a few others in the next weeks. I'm not saying the 17 Nov part should be deleted but I think we should add a mention that this is a plausible rumor and that there will be without doubt more scientific papers about those early cases in a short time. Reuns (talk) 21:44, 18 March 2020 (UTC)
According to SCMP's Mar 13 report, this first patient was the earliest documented patient confirmed to have Covid-19. This may not be the ‘patient zero’ who has yet to be confirmed. The Nov 17 disease contracted date was a trace-back by the reporter herself who has examined some government data directly. She also referred to a Lancet report which most likely is the one published January 24, 2020 "Clinical features of patients infected with 2019 novel coronavirus in Wuhan, China". In the report, the first patient having symptom onset was Dec 1st. (Fig 1B of the report). This corroborated with SCMP's report since the duration from contracting the virus to onset of symptom can be up to 14 days. This patient was not linked to the Seafood Market and was most likely admitted to hospital around Dec 16-18 according to Lancet and SCMP. Given the Lancet report has been peer-reviewed and SCMP's reporter Josephine Ma is an experienced China hand with first-hand access to Government data, I think the information provided are reliable. — Preceding unsigned comment added by Dihorse (talk • contribs) 08:00, 13 April 2020 (UTC)
SCMP is often saying nonsense, no idea why you think "Josephine Ma" is trustful when in the same time you are referring to scientific papers based on many official reports and written by the CDC as well as the ICU team of Wuhan's hospital. Reuns (talk) 08:33, 17 April 2020 (UTC)
- From the SCMP article:
According to the government data seen by the Post, a 55 year-old from Hubei province could have been the first person to have contracted Covid-19 on November 17. From that date onwards, one to five new cases were reported each day. By December 15, the total number of infections stood at 27
- By their description of the unsourced "records" they reviewed, if there were no more than 1 case per day, there would have been 28 cases by December 15. Even interpreted in the most favorable light, the article is incorrect in this assertion. The article is so poorly sourced, and the importance of the issue of fact is so high, that the assertion fails to be supported. Clearly here, there is no documented November 17 case.
- This November 17 reference in the timeline has been restored, but wrongly, I think. I look at this and call it what it is: a reporter (the SCMP reporter) reported that somebody (the SCMP in general) saw an unspecified document that had some somebody dated November 17. The reporter didn't see the document, doesn't report what the document was, doesn't say how it was created. The document may have been a list of possible people who may have had the virus, and upon further investigation, that guy was NOT deemed to be a COVID-19 subject. We have no idea. However, for the issue of fact the be correct: 1) the document would have had to be a list of people verified to have had COVID-19, and 2) the government and authorities would have had to suppress those facts in favor of sustaining another timeline, one which would be false and at risk of being disproved as such, to get what? A 2 week difference in the start of the timeline? At the risk of scientific/political credibility? This is the essence of rumor, bolstered only by the fact that it appears in a legitimate media outlet.
- To allow it to stand where it is in the timeline so as to suggest that HERE APPEARS TO BE THE INDEX CASE does a disservice to the timeline. Such a significant fact calls for significant evidence, and we don't have it. We don't know the index case at this time, and a valid timeline should reflect that. I'm not trying to be a pain-in-the neck. But if you look at how many follow-on stories will rely on this timeline, as it stands, this is problematic.--Bartinny (talk) 19:45, 26 April 2020 (UTC)
Date of first case in the U.S.
The first case in the U.S. is listed under both the 20th & 21st. It would seem that the 20th date is based on a misleading/inaccurate NYT timeline that bundles the first case in the U.S. with the first case in other countries. The documentation from the CDC, WHO, and even the article linked by the NYT show that the first case was on the 21st. Yaakovaryeh (talk) 21:02, 4 May 2020 (UTC)
Chronology and Events
This will be a bit talkative. I have looked over the beginning of the article and on impulse began to rephrase some of the paragraphs, probably as much for getting a grip on what had been going on - it's been years since I have followed the media. But I like texts, and that is my angle on the article. Concretely, what has me puzzled, is the section structure. I can vaguely understand different sorts of phenomena - the pandemic , talking about the pandemic (news reports), scientific engagements in the pandemic (those peer-revieved academic articles), government policies related to the pandemic, actual 'reallife' events that relates to the pandemic, however also actual 'reallife' reactions to talking about or to scientific engagements in or to government policies related to the pandemic. I think all these things have found their way into the article, and perhaps rightly so. But where does that leave the reader? (My usual interest is medieval and ancient history)
Maybe I'm just too impatient, and the article will over time settle to something else. But I turn to suggest an alternative section arrangement,
- The pandemic: Virus characteristics and clinical measures
- The pandemic: Politic & scientific activities, social reaction and media
I hope to read some inspiring comments! The thing is, what I had in mind with rephrasing paragraphs, got me stuck with quite a lot of rearranging. This discussion is not about a forecomming edit. My plan is to ..get through at least some of the Chinese language sources, like the article from Caixin of 26 February.. and that might take awhile. Good luck with the writing out there. Sechinsic (talk) 17:59, 24 April 2020 (UTC)
- I noticed the pageviews went thru the roof the day the AP story broke about the earlier French case. See here. The aim of a timeline is highly functional. It is a reader's shortcut to nailing down metadata and we should attempt to facilitate the reader. In short, its a table, a graph. The reader should be able to answer a quick query in regard to time. This redo is a solution in search of a problem. The reorganization muddles the purpose of the timeline. The subject does not matter. The date the action occurred is what our reader is seeking. Context is available elsewhere in more specialized Wikipedia articles or the sources that the timeline cites. Please help the reader. They will make their own conclusions. Church of the Rain (talk) 22:35, 5 May 2020 (UTC)