From Wikipedia, the free encyclopedia
1968 United States presidential election in Pennsylvania
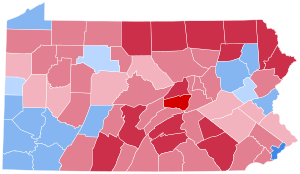
County Results Municipality Results
Humphrey
40-50%
50-60%
60-70%
70–80%
80–90%
Nixon
40-50%
50-60%
60-70%
70-80%
80–90%
90–100%
Tie/No Data
The 1968 United States presidential election in Pennsylvania took place on November 5, 1968, and was part of the 1968 United States presidential election . Voters chose 29 representatives, or electors to the Electoral College , who voted for president and vice president .
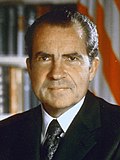
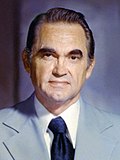
Pennsylvania voted for the Democratic nominee, Vice President Hubert Humphrey , over the Republican nominee, former Vice President Richard Nixon . Humphrey won Pennsylvania by a margin of 3.57%. A third-party candidate, former Alabama Governor George Wallace , played a significant role by winning 7.97% of the vote. This marked the first time since 1948 that a losing presidential candidate carried Pennsylvania, and the first time ever that the candidate was a Democrat. It would happen again only two more times, in George W. Bush 's elections in 2000 and 2004 , although the state voted for the popular vote winner in 2000. This also marked the first time a Republican won the presidency without Pennsylvania.
1968 United States presidential election in Pennsylvania[ 1]
Party
Candidate
Votes
Percentage
Electoral votes
Democratic Hubert Humphrey 2,259,405
47.59%
29
Republican
Richard Nixon
2,090,017
44.02%
0
American Independent
George Wallace
378,582
7.97%
0
Peace and Freedom
Dick Gregory
7,821
0.16%
0
Socialist Labor
Henning A. Blomen
4,977
0.10%
0
Militant Workers
Fred Halstead
4,862
0.10%
0
Write-ins
Write-ins
2,264
0.05%
0
Totals
4,747,928
100.0%
29
Voter Turnout (Voting age/Registered)
65%/85%
County
Hubert Humphrey
Richard Nixon
George Wallace
Various candidates
Margin
Total votes cast
#
%
#
%
#
%
#
%
#
%
Adams
5,993
31.70%
11,303
59.78%
1,579
8.35%
32
0.17%
-5,310
-28.08%
18,907
Allegheny
364,906
51.12%
264,790
37.09%
79,776
11.18%
4,345
0.61%
100,116
14.03%
713,817
Armstrong
13,921
45.86%
14,132
46.56%
2,256
7.43%
44
0.14%
-211
-0.70%
30,353
Beaver
45,396
55.34%
28,264
34.46%
7,974
9.72%
394
0.48%
17,132
20.88%
82,028
Bedford
4,725
28.61%
10,482
63.46%
1,301
7.88%
10
0.06%
-5,757
-34.85%
16,518
Berks
49,877
45.79%
50,623
46.48%
8,093
7.43%
331
0.30%
-746
-0.69%
108,924
Blair
15,803
32.72%
28,780
59.59%
3,644
7.55%
69
0.14%
-12,977
-26.87%
48,296
Bradford
6,373
30.26%
13,308
63.20%
1,347
6.40%
30
0.14%
-6,935
-32.94%
21,058
Bucks
57,634
40.24%
69,646
48.63%
15,211
10.62%
720
0.50%
-12,012
-8.39%
143,211
Butler
19,415
42.87%
21,618
47.73%
4,139
9.14%
119
0.26%
-2,203
-4.86%
45,291
Cambria
41,225
52.08%
33,280
42.05%
4,485
5.67%
160
0.20%
7,945
10.03%
79,150
Cameron
1,104
35.73%
1,822
58.96%
159
5.15%
5
0.16%
-718
-23.23%
3,090
Carbon
10,634
49.28%
9,954
46.13%
952
4.41%
39
0.18%
680
3.15%
21,579
Centre
11,163
39.13%
15,865
55.61%
1,389
4.87%
110
0.39%
-4,702
-16.48%
28,527
Chester
32,606
33.25%
56,073
57.19%
9,142
9.32%
230
0.23%
-23,467
-23.94%
98,051
Clarion
5,341
37.03%
8,077
56.00%
981
6.80%
24
0.17%
-2,736
-18.97%
14,423
Clearfield
12,369
42.41%
14,471
49.62%
2,252
7.72%
71
0.24%
-2,102
-7.21%
29,163
Clinton
6,301
46.65%
6,563
48.59%
625
4.63%
19
0.14%
-262
-1.94%
13,508
Columbia
8,187
36.83%
12,202
54.89%
1,797
8.08%
43
0.19%
-4,015
-18.06%
22,229
Crawford
11,345
40.19%
14,991
53.11%
1,832
6.49%
58
0.21%
-3,646
-12.92%
28,226
Cumberland
15,467
28.93%
32,908
61.54%
4,893
9.15%
204
0.38%
-17,441
-32.61%
53,472
Dauphin
25,480
31.15%
48,394
59.17%
7,534
9.21%
380
0.46%
-22,914
-28.02%
81,788
Delaware
106,695
40.05%
133,777
50.21%
25,051
9.40%
913
0.34%
-27,082
-10.16%
266,436
Elk
6,886
49.02%
6,193
44.09%
945
6.73%
22
0.16%
693
4.93%
14,046
Erie
51,604
51.68%
43,134
43.20%
4,868
4.88%
241
0.24%
8,470
8.48%
99,847
Fayette
34,340
57.76%
18,921
31.83%
5,984
10.07%
205
0.34%
15,419
25.93%
59,450
Forest
669
33.91%
1,172
59.40%
129
6.54%
3
0.15%
-503
-25.49%
1,973
Franklin
11,451
32.54%
19,146
54.40%
4,557
12.95%
41
0.12%
-7,695
-21.86%
35,195
Fulton
1,174
29.55%
2,200
55.37%
592
14.90%
7
0.18%
-1,026
-25.82%
3,973
Greene
8,198
56.93%
5,099
35.41%
1,094
7.60%
10
0.07%
3,099
21.52%
14,401
Huntingdon
4,128
30.83%
8,276
61.82%
962
7.19%
22
0.16%
-4,148
-30.99%
13,388
Indiana
12,175
41.70%
14,899
51.03%
2,078
7.12%
44
0.15%
-2,724
-9.33%
29,196
Jefferson
6,839
37.28%
10,214
55.67%
1,278
6.97%
16
0.09%
-3,375
-18.39%
18,347
Juniata
2,321
33.76%
4,039
58.76%
507
7.38%
7
0.10%
-1,718
-25.00%
6,874
Lackawanna
66,297
57.96%
44,388
38.80%
3,538
3.09%
168
0.15%
21,909
19.16%
114,391
Lancaster
29,870
27.58%
69,953
64.59%
8,194
7.57%
290
0.27%
-40,083
-37.01%
108,307
Lawrence
21,027
48.78%
18,360
42.60%
3,635
8.43%
81
0.19%
2,667
6.18%
43,103
Lebanon
9,529
28.01%
21,832
64.16%
2,584
7.59%
80
0.24%
-12,303
-36.15%
34,025
Lehigh
44,033
46.15%
47,255
49.53%
3,900
4.09%
220
0.23%
-3,222
-3.38%
95,408
Luzerne
79,040
55.13%
57,044
39.79%
6,857
4.78%
439
0.31%
21,996
15.34%
143,380
Lycoming
16,888
38.76%
23,830
54.70%
2,761
6.34%
87
0.20%
-6,942
-15.94%
43,566
McKean
6,326
35.93%
10,506
59.67%
745
4.23%
30
0.17%
-4,180
-23.74%
17,607
Mercer
22,814
46.46%
23,131
47.11%
3,033
6.18%
127
0.26%
-317
-0.65%
49,105
Mifflin
5,681
38.65%
8,133
55.33%
859
5.84%
25
0.17%
-2,452
-16.68%
14,698
Monroe
6,946
39.14%
9,465
53.33%
1,267
7.14%
69
0.39%
-2,519
-14.19%
17,747
Montgomery
102,464
39.30%
141,621
54.32%
15,599
5.98%
1,048
0.40%
-39,157
-15.02%
260,732
Montour
2,239
37.47%
3,289
55.04%
438
7.33%
10
0.17%
-1,050
-17.57%
5,976
Northampton
42,554
54.47%
32,033
41.00%
3,276
4.19%
267
0.34%
10,521
13.47%
78,130
Northumberland
17,013
40.60%
22,366
53.38%
2,456
5.86%
64
0.15%
-5,353
-12.78%
41,899
Perry
2,944
27.14%
6,655
61.34%
1,222
11.26%
28
0.26%
-3,711
-34.20%
10,849
Philadelphia
525,768
61.85%
254,153
29.90%
63,506
7.47%
6,690
0.79%
271,615
31.95%
850,117
Pike
1,617
27.93%
3,719
64.23%
441
7.62%
13
0.22%
-2,102
-36.30%
5,790
Potter
1,860
29.34%
4,019
63.40%
451
7.11%
9
0.14%
-2,159
-34.06%
6,339
Schuylkill
34,982
45.64%
37,194
48.53%
4,381
5.72%
88
0.11%
-2,212
-2.89%
76,645
Snyder
1,993
21.05%
6,784
71.64%
676
7.14%
16
0.17%
-4,791
-50.59%
9,469
Somerset
11,515
37.24%
17,511
56.63%
1,845
5.97%
50
0.16%
-5,996
-19.39%
30,921
Sullivan
1,035
36.06%
1,629
56.76%
200
6.97%
6
0.21%
-594
-20.70%
2,870
Susquehanna
4,364
31.10%
8,705
62.04%
929
6.62%
34
0.24%
-4,341
-30.94%
14,032
Tioga
3,488
25.16%
9,298
67.07%
1,065
7.68%
12
0.09%
-5,810
-41.91%
13,863
Union
2,178
23.64%
6,422
69.69%
581
6.30%
34
0.37%
-4,244
-46.05%
9,215
Venango
8,319
37.90%
12,323
56.14%
1,262
5.75%
45
0.21%
-4,004
-18.24%
21,949
Warren
6,368
39.88%
8,889
55.67%
676
4.23%
35
0.22%
-2,521
-15.79%
15,968
Washington
47,805
56.26%
28,023
32.98%
9,016
10.61%
124
0.15%
19,782
23.28%
84,968
Wayne
3,176
26.94%
7,827
66.39%
754
6.40%
33
0.28%
-4,651
-39.45%
11,790
Westmoreland
81,833
54.98%
52,206
35.08%
14,436
9.70%
364
0.24%
29,627
19.90%
148,839
Wyoming
2,366
29.12%
5,207
64.09%
539
6.63%
12
0.15%
-2,841
-34.97%
8,124
York
33,328
35.69%
51,631
55.30%
8,054
8.63%
358
0.38%
-18,303
-19.61%
93,371
Totals
2,259,405
47.59%
2,090,017
44.02%
378,582
7.97%
19,924
0.42%
169,388
3.57%
4,747,928
Counties that flipped from Democratic to Republican [ edit ]
^ Although he was born in California and he served as a U.S. Senator from California, in 1968 Richard Nixon’s official state of residence was New York, because he moved there to practice law after his defeat in the 1962 California gubernatorial election. During his first term as president, Nixon re-established his residency in California. Consequently, most reliable reference books list Nixon’s home state as New York in the 1968 election and his home state as California in the 1972 (and 1960) election.


