Portal:Mathematics/Selected picture/23
Appearance

Credit: Fangz (original uploader)
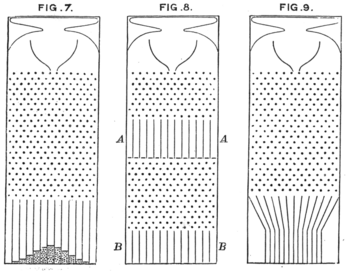
This is Francis Galton's original 1889 drawing of three versions of a "bean machine", now commonly called a "Galton box" (another name is a quincunx), a real-world device that can be used to illustrate the de Moivre–Laplace theorem of probability theory, which states that the normal distribution is a good approximation to the binomial distribution provided that the number of repeated "trials" associated with the latter distribution is sufficiently large. As the "bean" (i.e., a small ball) falls through the box (the design of which is quite similar to the popular Japanese game Pachinko), it can fall to the left or right of each pin it approaches. Since each lower pin is centered horizontally beneath a pair of higher pins (or a higher pin and the side of the box), the bean has the same probability of falling either way, and each such outcome is approximately independent of the others. Each row of pins thus corresponds to a Bernoulli trial with "success" probablility 0.5 ("success" is defined as falling a particular direction—say, to the right—each time). This makes the final position of the bean at the bottom of the box the sum of several approximately-independent Bernoulli random variables, and therefore approximately a random observation from a binomial distribution. (Note that because the bean may reach the side of the box and at that point only be able to fall in one direction, this sequence of Bernoulli random variables might be interrupted by a non-random movement back towards the center; this would not be a problem if the box were wide enough to prevent the bean from reaching the side of the box, as in the top half of Fig. 8—see also this photograph.) The box on the left, in Fig. 7, has 23 rows of pins (not counting the first row which is positioned in such a way that the bean always passes between two particular pins) and a final row of slots, so the number of trials in that case is 24. This is large enough that the resulting columns of beans collected at the bottom of the box show the classic "bell curve" shape of the normal distribution. While a level box gives a probability of 0.5 to fall either way at each pin, a tilted box results in asymmetric probabilities, and thus a skewed distribution (see this other photograph). Published in 1738 by Abraham de Moivre in the second edition of his textbook The Doctrine of Chances, the de Moivre–Laplace theorem is today recognized as a special case of the more familiar central limit theorem. Together these results underlie a great many statistical procedures widely used today in science, technology, business, and government to analyze data and make decisions.
