
Talk:United States presidential approval rating
| This article is written in American English, which has its own spelling conventions (color, defense, traveled) and some terms that are used in it may be different or absent from other varieties of English. According to the relevant style guide, this should not be changed without broad consensus. |
| The subject of this article is controversial and content may be in dispute. When updating the article, be bold, but not reckless. Feel free to try to improve the article, but don't take it personally if your changes are reversed; instead, come here to the talk page to discuss them. Content must be written from a neutral point of view. Include citations when adding content and consider tagging or removing unsourced information. |
| Please read and understand the following FAQ before attempting to edit this discussion page or the related article. Many editors have misunderstood these points and so looked rather silly. Don't be the next one! If you don't understand, please feel free to ask us! |
|
| This article is rated C-class on Wikipedia's content assessment scale. It is of interest to the following WikiProjects: | ||||||||||||||
| ||||||||||||||

.svg)
Carter Low-Point Not During Iran Hostage Crisis
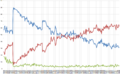
[edit]As the article correctly notes, Carter's approval ratings bottomed out in June and July 1979. But this was not during the Iran Hostage Crisis, which began in November of that year. As a glance at the graph in the article will show, Carter's approval rating shot up after that crisis.--BenA (talk) 18:03, 11 December 2008 (UTC)
It should probably be clarified that it dropped after his inability to save the hostages, etc. or something to that end. --205.207.104.225 (talk) 20:24, 23 May 2013 (UTC)
Things to add
[edit]I don't have time to add to articles, but a good idea would be to put up some generalizations as to what effect events such as war, crises, economic trends, and other factors have on presidential approval ratings - perhaps even two lists of things that increase or decrease them on a regular basis. Tholex 16:40, 14 April 2007 (UTC)
- Also... there is such a thing as a Congressional Approval Rating which I feel should be added to this. Here is the URL for the most recent Gallup Poll for Congress: http://www.galluppoll.com/content/?ci=27589
- I agree with Tholex, if that is the person who added the Congressional Approval Rating, It seems we are focusing too much on a president who has higher approval rating then the Congress. Alec92 (talk) 20:59, 25 November 2007 (UTC)
Here's what I just removed from the main article, as I don't have anything with which to replace it:
- Polling group's graphs of approval rating for the President George W. Bush
-
![ABCNews Poll.[1] April 22, 2001 to June 1, 2007.](//upload.wikimedia.org/wikipedia/commons/thumb/f/f6/ABCNews_Poll-Approval_Rating-George_W_Bush.png/120px-ABCNews_Poll-Approval_Rating-George_W_Bush.png) ABCNews Poll.[1] April 22, 2001 to June 1, 2007.
ABCNews Poll.[1] April 22, 2001 to June 1, 2007. -
![Newsweek Poll.[2][3] February 9, 2001 to July 12, 2007.](//upload.wikimedia.org/wikipedia/en/thumb/a/a2/Newsweek_Poll-Approval_Rating-George_W_Bush.png/120px-Newsweek_Poll-Approval_Rating-George_W_Bush.png)
-
 CBS News/New York Times. February 2001 to February 2008.
![ABCNews Poll.[1] April 22, 2001 to June 1, 2007.](/wiki/File:ABCNews_Poll-Approval_Rating-George_W_Bush.png)
![Newsweek Poll.[2][3] February 9, 2001 to July 12, 2007.](/wiki/File:Newsweek_Poll-Approval_Rating-George_W_Bush.png)

It might be nice to see some similar graphs for Obama. Jsharpminor (talk) 18:34, 28 July 2009 (UTC)
Harris and Zogby polls
[edit]The Harris Poll uses the question "How would you rate the overall job President Bush is doing as president, excellent, pretty good, only fair or poor".
Those saying excellent and pretty good are added.
Those saying only fair and poor are added (those saying fair probably too).
The additions are published.
The word approval is never mentionned.
http://www.harrisinteractive.com/harris_poll/index.asp?PID=764
The Zogby Poll uses the question "Overall, how would you rate President Bush's performance on the job?".
Those saying excellent and good are added.
Those saying fair and poor are added.
The additions are published.
The word approval is never mentionned.
http://www.zogby.com/news/wf-Zogbyshort.pdf
--Jean-Francois Landry 23:34, 12 July 2007 (UTC)
Average aproval
[edit]What about the highest and lowest averages? AJUK Talk!! 17:23, 24 October 2007 (UTC)
Possible vandalism???
[edit]Dudes, I question the authenticity of the record for "second equal lowest" approval rating that apparently the Great Bush holds with 20% approval. It would appear to be from a batch of vandalous (sp?) edits which also gave President Clinton the record for highest approval rating (95%). Someone should roll that back. I'd do it myself but I like seeing it there. —Preceding unsigned comment added by 70.41.39.31 (talk) 02:57, 7 November 2007 (UTC)
Lowest Ever
[edit]It appears that the 19% approval rating for Bush is an error. I cannot find a poll anywhere that lists him as being that low. 28% looks like the lowest from a bipartisan polling firm. —Preceding unsigned comment added by 207.62.143.191 (talk) 16:20, 12 April 2008 (UTC)
The page for Truman also says that he had the lowest ever with 28%... —Preceding unsigned comment added by Loncaros (talk • contribs) 15:49, 11 July 2008 (UTC)
It comes from an "American Research Group" poll. These are the same guys who had Huckabee ahead in the Virginia primary. RealClearPolitics used to list them with an asterisk; now they don't even list them anymore. Pretty much every ARG result is way out in left field. In February Bush didn't poll below 28 in any other poll, but ARG had him at 19. I think someone with an anti-Bush agenda added the number to make him look especially bad. —Preceding unsigned comment added by 76.104.224.142 (talk) 16:40, 30 August 2008 (UTC)
This CBS poll has Bush at a record low 20 percent and leaving office at 22 percent: http://www.cbsnews.com/news/bushs-final-approval-rating-22-percent/ — Preceding unsigned comment added by 70.113.105.252 (talk) 18:59, 4 June 2015 (UTC)
Graph legends?
[edit]It appears most of the graphs are using the same green/yellow/red color-coding scheme but nowhere in the article (nor in the image description pages themselves) is it explained... Pimlottc (talk) 23:03, 22 April 2008 (UTC)
Order of presidential graphs
[edit]I think it would make sense to put the presidential graphs in chronological order rather than reverse chronological order. Also possibly to stretch them to match the length of their terms.--Natcase (talk) 13:51, 1 September 2008 (UTC)
Article name
[edit]Recommend renaming to "Ratings of the President of the United States"; article includes both approval and disapproval ratings and the syntax conforms to the MOS. --—— Gadget850 (Ed) talk - 14:15, 1 October 2008 (UTC)
Consistency
[edit]Shouldn't all the polls on this page be Gallup? Or at least an aggregate of all available polls? It's cherry-picking otherwise. 210.215.140.180 (talk) 05:11, 10 November 2008 (UTC)
It would be nice if each level of approval on the map had a different color. The use of various shades of purple is confusing.
United States presidential approval rating - Wikipedia https://en.wikipedia.org/wiki/United_States_presidential_approval_rating Waffleslave (talk) 11:32, 5 January 2020 (UTC)
I fully agree
[edit]I was looking for an accurate comparison of some of our past presidents, their highest and lowest numbers. But you cannot cherry-pick any poll and expect it to be directly comparable to other polls. I am pretty sure Gallup never tracked the current president at 19. That's a huge swing, and for the purpose of fairness and consistency, they should all be Gallup. So, where do we go about getting the exact numbers to fix the page?—Preceding unsigned comment added by 67.163.102.84 (talk) 02:02, 15 December 2008 (UTC)
Lowest maximum approval rating during the president term in office
[edit]Shouldn't someone update this as Obamas approval rating is now 41%? Im sorry but Bush has never had 31 percent approvel. the lowest he ever got is same as Obama. 41. —Preceding unsigned comment added by Lollipopfop (talk • contribs) 02:27, 9 April 2010 (UTC)
That's not true Lollipop. Please don't lie. If you feel you have some __factual__, as in a true statement based in reality, then please add a link for your RELIABLE source of data. Otherwise, you're just spouting off like everyone else. ->A non-Lollipopfop. — Preceding unsigned comment added by 24.129.114.152 (talk) 19:54, 24 October 2011 (UTC)
Should Obama not be ranked third seeing as he has never exceeded 69%? Or are we only showing data based on a complete 4 year term? 206.108.31.36 (talk) 19:13, 13 March 2009 (UTC)
People, Obama's only been in office for 59 days. It's hardly rational to show him as the highest low approval rating -- his approval hasn't had time to have high lows or low highs. I'm removing it. Jsharpminor (talk) 17:54, 20 March 2009 (UTC)
== Highest Maximum Approval Rating During the President Term in Office "" I'm removing this whole section (how is Highest Maximum Approval different from Highest Approval Rating) Also FDR can't be #1 and tied for #3. —Preceding unsigned comment added by 70.234.218.143 (talk) 23:58, 23 May 2009 (UTC)
Shouldn't there be consistency in how many are list in the Highest/Lowest sections? Four or Five seems good. —Preceding unsigned comment added by 70.234.218.143 (talk) 00:16, 24 May 2009 (UTC)
- I'm changing the way these are worded, because it seems to be ridiculous. If you have 5 people competing and 1 wins but it was a 3-way tie for 2nd, then you say that there was a 1st place, a 3-way tie for 2nd, but you know exactly who was in 5th: the last runner. He didn't come in 3rd. So, for example, we might have the following:
- Alfred Smith holds the record with 48%
- Bart Doe is second-equal lowest with 51%
- Charlie Brown is second-equal lowest with 51%
- Dave Miller is fourth-equal lowest with 52%
- Edward Brown is fourth-equal lowest with 52%
- This is in contrast to how it is currently stated: on some sections, they would say that Dave Miller and Edward Brown are third-equal lowest, which is clearly incorrect. Also, when there's a reference to Henry Ford who is fifth lowest, I'll remove that and put it on the talk page for reference. Four is good enough for some sections, it should be good enough for all. This should improve consistency in the article. Jsharpminor (talk) 02:28, 27 July 2009 (UTC)
- Following is the data removed from the page in making the preceding edit:
- Highest Minimum:
- Gerald Ford is tied for fifth place with 37% (3/28-31/1975)
- Bill Clinton is tied for fifth place with 37% (5/26-27/1993)
- Gerald Ford is tied for fifth place with 37% (3/28-31/1975)
- Biggest difference:
- Lyndon B. Johnson is fifth highest with 43 percentage points.
- Highest Minimum:
- Following is the data removed from the page in making the preceding edit:
Current President
[edit]George W Bush seems to take up an inordinate amount of space with graphs and data tables. This made some sense while he was President, but now that he is out of office, isn't it time to replace this section with the current President? If not today, there should be a point that can be agreed upon some time in the near future. I think that time is now, but I don't want to start some kind of edit war with the anti-Bush/anti-Obama folks. —Preceding unsigned comment added by 70.234.218.143 (talk) 19:13, 12 June 2009 (UTC)
George Bush will probably take up most of the graph and data table space until Barack Obama's out of office. Bush's chart covers his entire time as president, and Obama's only been in for 6 months. These charts cover entire terms, not month intervals. 76.205.68.15 (talk) 22:52, 19 June 2009 (UTC)
I actually think to be fair only Obama should be referenced in this article with the graphs because he is our current president. We should have sub-articles available to click to this information for all other presidents. David1982m (talk) 17:42, 22 June 2009 (UTC)
I think all the historic graphs and polling data should stay as it is what the article is all about. However, it is time to replace Bush with Obama in the current data. 70.234.217.129 (talk) 16:37, 9 July 2009 (UTC)
Check this out. http://en.wikipedia.org/wiki/File:Obama_Approval.png Go ahead and update the page. Jsharpminor (talk) 18:48, 27 July 2009 (UTC)
- Okay, it's done. I've given this page a major overhaul. All of the information as far as I can see is current, correct, and cited. I've also removed some original research and unsourced data, and changed the page to only reflect actual data on past Presidents since FDR (or in some cases, since Truman). Jsharpminor (talk) 19:39, 28 July 2009 (UTC)
Thank you!!! 70.234.217.129 (talk) 23:40, 28 July 2009 (UTC)
Updating Obama's High and Lows
[edit]I notice a lot of changes have been happening to his Lows. I saw 59, then 58. I checked Gallup and the 58 was right, but now changed again to 57. I understand this will change, but so information is verifiable, I really think we are going to change the highs and lows, we should include the reference article. The average I'm not so worried about because that is simply mathematical (High plus Low divided 2) everything you should show have a link to a reference article. David1982m (talk) 15:38, 22 June 2009 (UTC)
Someone did it again. If you have a Gallup Poll article that shows 57 for Obama, add it and reference the article. If you don't then stop changing it until you have a source. Diamond Dave (talk) 15:38, 22 June 2009 (UTC) 11:53, 23 June 2009 (UTC)
- I have never familiarized myself with Wikifying references, but here it is: http://www.gallup.com/poll/113980/Gallup-Daily-Obama-Job-Approval.aspx . Anyone who cares to add the reference may do so. This URL doesn't change; I have it bookmarked in Firefox. Jsharpminor (talk) 02:23, 27 July 2009 (UTC)
What is the source for Obama's Average Approval Rating? Average approval isn't simply 'High plus Low divided by 2'. 70.234.217.129 (talk) 17:24, 27 July 2009 (UTC)
I just want to point out that someone has 46% has Obama's low point. This is not accurate since the numbers, at least according to the description, are "supposed" to be based on Gallup's numbers. Right now, Obama's low point with Gallup is 50%. The 46% comes from Rasmussen Reports. You can't mix different polls to give an accurate picture. Pick one poll and use that throughout. 24.127.96.47 (talk) 16:52, 1 September 2009 (UTC)
- I've reverted the edit. Timmeh (review me) 20:04, 1 September 2009 (UTC)
Obama's disapproval rating currently 60% according to the latest Zogby polls as of 11/23/2010. His approval rating is sitting at 39%. http://zogby.com/news/ReadNews.cfm?ID=1924 http://latimesblogs.latimes.com/washington/2010/11/obama-romney-palin.html I didn't update because I wasn't sure if you could add something about the Zogby poll or not. So I thought I would just mention it for whatever it is worth. 24.217.131.76 (talk) —Preceding undated comment added 02:07, 24 November 2010 (UTC).
- This page uses the Gallup polls for the high point / low point chart. The chart at the top of the page may use any respectable poll (i.e. a poll of your friends doesn't count). Please feel free to update with these guidelines. Thanks!! Jsharpminor (talk) 07:24, 12 April 2011 (UTC)
Data and Reference source
[edit]David1982m undid several changes and put back many inaccuracies. The source listed in references is http://www.gallup.com/poll/116677/Presidential-Approval-Ratings-Gallup-Historical-Statistics-Trends.aspx That is what was used for the data. If you want to use other data, please add a reference for it. I thought that there was a consensus that Gallup data should be used for consistency and for the historical perspective of previous administrations. 70.234.217.129 (talk) 18:50, 19 July 2009 (UTC)
And then went in and changed them back to what I had in there in the first place. I'm not sure what you were trying to do or why you question the source. You also put back dates in the AVERAGE section. What do they have to do with the average? What is the source for the dates? 70.234.217.129 (talk) 19:34, 19 July 2009 (UTC)
Maybe someone else changed your changes and I got confused, but the numbers I saw on the article weren't matching the source, but seems ok now. Diamond Dave 17:52, 23 July 2009 (UTC) —Preceding unsigned comment added by David1982m (talk • contribs)
Average approval is NOT 'High plus Low divided by 2'
[edit]Even the Microsoft page that you reference doesn't say that. It says the sum of ALL then data points divided by the NUMBER of data points is the average. Bush 43 would be several points higher if you just took the High and Low and divided by 2. Bush 41 would be lower. Unless you can find a source (preferably, Gallup) for these averages, they should be set back to '--' or 'N/A'. —Preceding unsigned comment added by 70.234.217.129 (talk) 18:27, 31 July 2009 (UTC)
There are 2 DATA POINTS. The High and Low Approval Ratings are the 2 data points, so add them and then since there are only 2 data points divide them by 2. I put the asterisk there, indicating it is not entirely accurate. It is only based upon those source, so the page can be consist. Because if we have averages for the other and not for them it doesn't seem accurate. We need to either remove Obama and FDR entirely or remove the average approval ratings or both. --Diamond Dave 20:33, 31 July 2009 (UTC)
The point is there are not just 2 data points. You are selecting 2 (the highest and the lowest), there many others in each series that you are choosing to ignore. What you are using is not sourced to anything (because that isn't how averages are figured) and is inconsistent with the other presidents which have actual averages. As for removing Obama and FDR, I don't see the need for that as we have the data available for everything except the average. Approximations don't belong in this article. 70.234.217.129 (talk) 23:12, 31 July 2009 (UTC)
- DavidM, you're wrong. I've spent enough time fixing your mistakes, I would appreciate it if you would stop conflicting with what the consensus is saying. I've reverted your edits twice now, and I'm not doing it a third time because I don't want to be accused of getting into an edit war. Any Wikians with more experience in these matters, please advise me on what to do! This is the first time that I've been contradicted when editing an article, and while I think I'm right, I don't want to go to war over it and start being seen as a disruptive editor. I will continue to update the article, but I disagree strongly with the latest rash of edits and I think they should all be undone, but not by me any more. Jsharpminor (talk) 01:47, 1 August 2009 (UTC)
Totally laughable. Not only are you not right but purposeful ignorance is not an excuse. But hey great job using statistics to do anything but characterize what took place-pro liberal denialist in the making spinbot material. Maybe take a look at the graphs and explain how those with the most green do not have the highest averages or something mathematically impossible. — Preceding unsigned comment added by 98.225.252.201 (talk) 19:08, 15 June 2014 (UTC)
- Also, in response to 70.234.217.129 : I can agree with including Obama and FDR's incomplete statistics. That, at least, is based on available data. Some of these other edits clearly are not. Jsharpminor (talk) 01:49, 1 August 2009 (UTC)
- FDR's Gallup numbers are forever incomplete as Gallup didn't start polling until the middle of his presidency. I would be fine with omitting FDR completely (first choice since Gallup doesn't list them) or using third party archives of what they were (second choice), but High and Low should be *'ed and average omitted as it is meaning less without a complete dataset. Obama is different. The dataset is complete, it just changes daily. High and Low are easy to pull when it changes. The average would have to be recalculated daily as Gallup doesn't do that for us and we do not know how they weight individual data points when they do calculate them. Obama's average should be omitted (first choice) or recalculated daily (distant second choice). But under no circumstance should we manufacture an average using High and Low as the full dataset. 70.234.217.129 (talk) 18:01, 1 August 2009 (UTC)
- Just for grins I downloaded the raw data for Obama from Gallup. As of today (assuming equal weight for each data point), Obama's average approval is 62.059 (62.1). If we want to use that, fine. But if it isn't updated every day, it is inaccurate and shouldn't be there. 70.234.217.129 (talk) 18:40, 1 August 2009 (UTC)
I have not heard a concensus only you Jsharpminor and 70.234.217.129, but I am open to hearing more feedback. But, you will note I do agree with you which is I included your sources with each of my edits and then added the definition of how an average is calculated so it's understood how the average was calculated, and so that section can stay consistent. By having the asterisk there, it indicates that the information is not entirely accurate as you confirmed with your source that the info for FDR and Obama are not accurate. I believe I have cleaned up my edits to consistently reflect that they are not accurate based upon your source and I have stated the average is found by basic math and not from Gallup and only there for consistency.Diamond Dave 20:33, 31 July 2009 (UTC) —Preceding unsigned comment added by David1982m (talk • contribs)
- David, thank you for responding! It's good to see things like that...before this last post, I was quite honestly worried. But I'd like to mention something to you: If you do something to a page, then someone goes and undoes it, don't put it back -- that is highly frowned upon in Wikipedia style. You'll notice that I mentioned that I'm stepping back. However, as far as inaccurate averages go... they really have no place in the article, unless you can source the numbers, not just how you calculate them. There's no need to link us to math books, we all know how averages work. Can you find an average out there somewhere, that is based on the Gallup polls? Jsharpminor (talk) 02:35, 1 August 2009 (UTC)
I see your point, it just doesn't look right without averages for FDR or Obama on there. I just figured with an asterisk and yours and my source, it would make it ok. Many text books refer to things that are theoretical and do not have all the facts and I figure since. But it also bothers me that their is no specific Gallup source list for FDRs approval ratings at all. If there was, then I might be able to use my source because then the math could be done for every time they have rated his approval. I can't find anything about FDR on the gallup website for FDR, which makes me wonder if we should even include him at all. I would like to hear some other opinions on this because it just seems like more should done. Diamond Dave 07:53, 1 August 2009 (UTC) —Preceding unsigned comment added by David1982m (talk • contribs)
- Well, I can agree at least for the FDR average, but you need to have it sourced. If you can find it sourced from the Gallup numbers, then feel free to source it. Otherwise, I am going to remove both averages on 13 August 2009 at 0000 UTC. If any other editors object to this, please let me know about it in the next 49.75 hours. Also, there needs to be a source on the Obama average unless it too is to be removed.Jsharpminor (talk) 22:15, 10 August 2009 (UTC)
- DavidM, you should also look at the references for the article, that's why they're there. I specifically direct you to [page], which is currently cited as link #12 on the article main page -- it is also referenced right by FDR's numbers. I do not know why Gallup does not include these numbers on their publicly available data pages; I can guess, though, that it's because they don't want people to assume that the numbers are complete when in fact they are not. (Sound familiar?) ;-) Jsharpminor (talk) 22:23, 10 August 2009 (UTC)
- The Obama term average does appear to be sourced to Gallup. I am not sure how often it is updated. It isn't daily like the other numbers. I've been watching the source and it looks to be weekly or bi-weekly. The number is correct, but should probably be cited as through a certain date. The most current information on the page is through August 9th. I would assume that all averages on there would also include data to that date, though it is not explicitly stated as such. If the reference for Obama was cited as being as of a certain date, I think it should stay. FDR should be removed or the dates noted as not being complete. This applies to high and low only. Average is meaningless with incomplete data. Thank you for doing this. I've been staying out of edits. I don't want or need to explain again how the third horse behind a tie for first IS NOT SECOND!!! 70.234.210.65 (talk) 18:33, 12 August 2009 (UTC)
- Once again I have given the article a major factual overhaul. I would like to thank especially 70.234.210.65 and 70.234.217.129 for their valuable input. I would also like to insist that anyone who disagrees with what has been discussed and decided on this talk page, please come here and dispute it before changing the page back to suit your whims. There is enough work to do in reverting the disruptive edits without having to worry about undoing edits by well-meaning but willfully uninformed editors. Thanks all! :-) Jsharpminor (talk) 00:12, 13 August 2009 (UTC)
- Aaaand, tada!!! Check out my new FAQ! Please edit it or change it as is necessary. Hopefully, this might give a few of the more misinformed people a basic primer on statistics? Maybe that's just wishful thinking... "You can lead a horse to water, but you can't make him drink." (i.e. "you can lead a man to knowledge, but you can't make him think.") :-) Cheers! Jsharpminor (talk) 01:52, 13 August 2009 (UTC)
- The Obama term average does appear to be sourced to Gallup. I am not sure how often it is updated. It isn't daily like the other numbers. I've been watching the source and it looks to be weekly or bi-weekly. The number is correct, but should probably be cited as through a certain date. The most current information on the page is through August 9th. I would assume that all averages on there would also include data to that date, though it is not explicitly stated as such. If the reference for Obama was cited as being as of a certain date, I think it should stay. FDR should be removed or the dates noted as not being complete. This applies to high and low only. Average is meaningless with incomplete data. Thank you for doing this. I've been staying out of edits. I don't want or need to explain again how the third horse behind a tie for first IS NOT SECOND!!! 70.234.210.65 (talk) 18:33, 12 August 2009 (UTC)
- Does anyone have a source for FDR? JSharpminor, I understand your reasoning for the change, but do you have source indicating that? Also, to connect with that I have search Gallup High and low for those figures for FDR and I cannot find them, but rights, if FDR does not have a source reference he shouldn't be included. From what I understand according to Wikipedia rules everything must have a source not ORIGINAL WORK as it stands your statement about FDR is original work until a source is found (a Gallup source), however, his Highs and lows are original work because there is no source for them at this time. I wonder if FDR should be removed from the list for that reason. As for Obama that source I put shows his term average that is likely to be changing as time goes on, it looks like they update it everyday. The source should be displayed, so we can update it as time goes on. Your thoughts? Diamond Dave 15:55, 13 August 2009 (UTC) —Preceding unsigned comment added by David1982m (talk • contribs)
- DavidM, welcome to Wikipedia. Right next to FDR's numbers is a little number in parentheses that points to the bottom of the page. Looking at the corresponding reference, you see where FDR's numbers are sourced from Gallup data -- but not on the Gallup web site itself. This page is under dispute, but there is a consensus. I have been nice, I am now going to tell you frankly -- stop your disruptive editing or you will most likely be facing a block. Read the FAQ -- just because the work is not sourced on the sections of the Gallup website that non-paying non-members like yourself do not have access to does not mean that the information is inaccurate. I am putting those numbers back. Davidm, please do not edit this page any further without discussing it first on the talk page. Jsharpminor (talk) 23:10, 13 August 2009 (UTC)
- Also, David1982m, please read the FAQ that I put at the top of this page with you in mind. I really don't like that I'm starting to sound aggravated, but you're really starting to become aggravating by going against what other editors are saying. I appreciate that you're trying to be helpful, but it's obvious that you don't understand some of the finer points of statistics and Wikipedia. You'll find people much more agreeable if you can just listen to them before undoing their work. Jsharpminor (talk) 23:44, 13 August 2009 (UTC)
- DavidM, welcome to Wikipedia. Right next to FDR's numbers is a little number in parentheses that points to the bottom of the page. Looking at the corresponding reference, you see where FDR's numbers are sourced from Gallup data -- but not on the Gallup web site itself. This page is under dispute, but there is a consensus. I have been nice, I am now going to tell you frankly -- stop your disruptive editing or you will most likely be facing a block. Read the FAQ -- just because the work is not sourced on the sections of the Gallup website that non-paying non-members like yourself do not have access to does not mean that the information is inaccurate. I am putting those numbers back. Davidm, please do not edit this page any further without discussing it first on the talk page. Jsharpminor (talk) 23:10, 13 August 2009 (UTC)
- Does anyone have a source for FDR? JSharpminor, I understand your reasoning for the change, but do you have source indicating that? Also, to connect with that I have search Gallup High and low for those figures for FDR and I cannot find them, but rights, if FDR does not have a source reference he shouldn't be included. From what I understand according to Wikipedia rules everything must have a source not ORIGINAL WORK as it stands your statement about FDR is original work until a source is found (a Gallup source), however, his Highs and lows are original work because there is no source for them at this time. I wonder if FDR should be removed from the list for that reason. As for Obama that source I put shows his term average that is likely to be changing as time goes on, it looks like they update it everyday. The source should be displayed, so we can update it as time goes on. Your thoughts? Diamond Dave 15:55, 13 August 2009 (UTC) —Preceding unsigned comment added by David1982m (talk • contribs)
- JSharpminor, what consensus, it's only you. I'm trying to be cooperative. Non-paying non-members, what the hell do you mean by that? You're the only editor making comments about these changes and maybe one. Secondly I didn't realize that was a valid source, it was honest mistake. I don't know why you have to be so rude about this and then go to lengths of blocking my access. You're not being nice at all. Your attitude is rude. I have debated edits with others before and come to reasonable consensus, but you really take the cake. Now, you act like this article sole properly. I'm really what is wrong with you? You are the only unreasonable editor I have met. 02:31, 15 August 2009 (UTC) David1982m (talk •
I am an objective observer. David M you are the unreasonable one. 124.179.75.114 (talk) 16:48, 18 August 2009 (UTC)
Updating President's chart
[edit]Just a question: when will President Obama's Gallup chart be updated? It only covers to July 27, 2009. —Preceding unsigned comment added by 76.205.68.126 (talk) 22:13, 7 August 2009 (UTC)
- It will be updated whenever a Wikian (like yourself) cares to go through the effort of updating it. ;-) Jsharpminor (talk) 22:12, 10 August 2009 (UTC)
Washington Post poll from October 2, 2010 has approval at 50% vs 47% disapproval. http://www.washingtonpost.com/wp-srv/politics/polls/postpoll_10052010.html?sid=ST2010100500023 —Preceding unsigned comment added by 24.86.167.119 (talk) 18:07, 11 October 2010 (UTC)
FDR Removal
[edit]I originally advocated for removing FDR completely because of the consensus to only use Gallup data and the fact that the Gallup site does not list the data for him (probably because it does not include data for his whole time in office). There is, however, data available at the Roper Center Public Opinion Archives (University of Connecticut) http://webapps.ropercenter.uconn.edu/CFIDE/roper/presidential/webroot/presidential_rating_detail.cfm?allRate=True&presidentName=Roosevelt for the Gallup data from 08/04/1937 through 12/01/1944. At the time I appeared to be the only one suggesting that FDR be removed, so I didn't. With this data available, I now think that FDR should NOT be removed. I still believe that FDR AVERAGES should not be included as they are meaningless if they don't cover his entire presidency, but High and Low should - with the notation that they are for the period covered.
Someone has removed FDR. What does everyone think? I'll put him back, but with some of the 'editing' that has been going on, I don't want to start another war. Please comment.
Also, the FAQ section is now blank. What happened to that very useful information? 70.234.210.65 (talk) 20:56, 15 August 2009 (UTC)
- I removed him because the data doesn't cover his entire presidency. If the average is meaningless, as is apparently the consensus, then the high and low numbers are as well. Timmeh (review me) 21:42, 15 August 2009 (UTC)
- I would disagree that the High and Low are meaningless just because the Average is. We have data from 1937 on. Hypothetical: FDR had an approval rating of 91% at some point in 1940. He would have the highest approval that Gallup has ever recorded. How is that meaningless? If he had an even higher one prior to that but it wasn't recorded, it is still the highest of any President ever recorded. If he never had one higher before that, it is still the highest. Same goes for the lowest.
- Like I said earlier, I was the one that origially suggested removing him completely but have changed my mind after thinking about it. At the time there was one editor that insisted on making up his own 'average' by using the formula (High + Low) / 2 = Average. I was the only one at the time that seemed to be of that mind so I left it alone. We know from the source above (unless you are arguing it is not a Reliable Source) that his approval was as high as 84% (1/8-13/1942) and as low as 48% (8/18-24/1939). That puts him at #4 Highest ever.
- If you are arguing that Highest Minimum and Lowest Maximum are meaningless, I would agree with that as we don't know what those values are. 70.234.210.65 (talk) 22:18, 15 August 2009 (UTC)
- To be consistent, we either need to remove FDR completely, or keep all his data there with a clearly visible note that Gallup did not start recording his approval until 1937. I'd support the former simply for accuracy and clarity. About the highest/lowest numbers, we already have lists of who got the highest and lowest approval ratings, so really there's no need to show it again in the table above them, especially as they do not reflect his whole time in office, meaning they may not be accurate. Timmeh (review me) 22:36, 15 August 2009 (UTC)
- I disagree, and think High and Low should be included in the table. I agree that if they are, they should be noted for the dates involved. If they are not going to be in the table, they should not be in the lists, either. He should be removed from #4 highest. I will accept it either way as I'm not going to change it.
- On a separate note, the names in the lists should be consistent. Either include middle initial for all of them or omit it for all (except the Bush's to distinguish 41 & 43). I'd do all this myself, but I get tired of the constant editting by a few editors. One step forward, two steps back. 70.234.210.65 (talk) 22:49, 15 August 2009 (UTC)
- Could you explain why you think the high and low numbers should be included in the table? As for the names, don't be afraid to change them. They're a fairly minor issue and one which I don't think people will edit war over. Timmeh (review me) 02:48, 16 August 2009 (UTC)
- OK. I changed it. Let's see what happens. 70.234.210.65 (talk) 22:25, 16 August 2009 (UTC)
- Took less than 24 hours for someone to undo it all. 70.234.210.65 (talk) 21:52, 17 August 2009 (UTC)
- It wasn't me who changed the names back. But I don't think that they should be changed; they're the names that the Presidents are usually known by. For example: try to say President John Kennedy. Just try it. I bet you were tempted to put the "F." in there? He's almost always spoken of as "John F Kennedy," "JFK," or occasionally just "Kennedy," but if the first name is there, the middle initial is, too. Same with Bush II. Reagan, on the other hand... do you even know what Reagan's middle initial is? How about Carter's? I say we should leave the names the way they are; they're not consistent with each other, but they're consistent with public memory. Jsharpminor (talk) 05:27, 18 August 2009 (UTC)
- As for FDR being included. We HAVE the information, it IS encyclopedic, it IS from a Reliable Source, consensus HAS been reached to use Gallup data only. Frankly, there is no reason NOT to include it. Could you explain why you removed it from the table (and then not from the lists)? 70.234.210.65 (talk) 22:38, 16 August 2009 (UTC)
- Just as a side note since some asked Harry S Truman (parents never gave him a middle name, just the initial), Dwight David Eisenhower (often called Dwight D., but was born David Dwight), John Fitzgerald Kennedy (always called JFK, John F. Kennedy, or Kennedy), Lyndon Baines Johnson (often called Lyndon B. Johnson, sometimes Lyndon Baines Johnson, sometimes LBJ, and rarely Lyndon Johnson, Richard Milhous Nixon (usually called Richard Nixon, sometimes Richard M. Nixon [Richard E. Nixon according to Archie Bunker, lol], occasionally Dick Nixon), Gerald Rudolph Ford (sometimes referred to as Gerry Ford, but usually appears as Gerald R. Ford), James Earl Carter (usually called Jimmy, but history books often have him as James Earl), Ronald Wilson Reagan (usually called Ronald, but occasionally Ron, some history books have him as Ronald W. Reagan), George Herbert Walker Bush (before his son he was always referred as George Bush, after his son George H. W. Bush or the full name), William Jefferson Clinton (always called Bill Clinton, almost never referred to as William or William Jefferson Clinton, and never William J.), George Walker Bush (called George W. or sometimes just W), Barack Hussein Obama (it's been considered in poor taste to use his middle name, however a few source show him as Barack H., but usually Barack Obama or Obama. —Preceding unsigned comment added by David1982m (talk • contribs) 13:56, 18 August 2009 (UTC)
Regarding: "Someone has removed FDR. What does everyone think? I'll put him back, but with some of the 'editing' that has been going on, I don't want to start another war. Please comment." PLEASE PUT BACK THAT DATA. All of the data is important for a "Universal Encyclopedia"...we don't need people's political prejudices ruining a useful archive. Please put the data back. Thank you. Mr. Haberdasher. — Preceding unsigned comment added by 24.129.114.152 (talk) 19:58, 24 October 2011 (UTC)
I say put ALL FDR BACK with AVERAGES, but just asterisk that is incomplete. --205.207.104.225 (talk) 20:33, 23 May 2013 (UTC)
Source for list
[edit]Timmeh, I went in and cleaned up the references for the list. The only reason the Roper Center reference was there was because it showed Gallup data for FDR. You removed FDR, so now the best reference for the whole table is Gallup's page for historical data on past presidents. There is a consensus here to only use Gallup data for comparisons. Why is the Roper Center a better reference for Gallup data than Gallup itself? That was the edit I made. You undid it commenting "unexplained removal of sources". Did you even bother to look at the reference I put in and compare it to the one that was removed?
JSharpMinor, I feel your pain. 70.234.210.65 (talk) 20:29, 19 August 2009 (UTC)
- Ah, in fact your edit was correct. Looking at it closer, I see that Gallup does indeed have all the data in the table, except Obama's. Please accept my apologies. However, if you had explained your removal in an edit summary, this mixup likely would not have happened. Timmeh (review me) 20:45, 19 August 2009 (UTC)
- No harm, no foul. This turns out to be a very contentious page, though it is so extremely factual that there should be no controversy. I should have commented on the change, but it seemed so non-controversial, I didn't. I don't know why, but this page seems to attract editors that want to change and/or slant the content. It is what it is. Thank you for changing it back. 70.234.210.65 (talk) 21:02, 19 August 2009 (UTC)
- Yeah, politics-related articles are often the subject of a lot of controversy. Actually, the activity on this page is nothing compared to what United States presidential election, 2008 was like during the months surrounding the event. That page had to be semi-protected several times because of vandalism. Timmeh (review me) 21:11, 19 August 2009 (UTC)
- No harm, no foul. This turns out to be a very contentious page, though it is so extremely factual that there should be no controversy. I should have commented on the change, but it seemed so non-controversial, I didn't. I don't know why, but this page seems to attract editors that want to change and/or slant the content. It is what it is. Thank you for changing it back. 70.234.210.65 (talk) 21:02, 19 August 2009 (UTC)
Regarding: "Someone has removed FDR. What does everyone think? I'll put him back, but with some of the 'editing' that has been going on, I don't want to start another war. Please comment." PLEASE PUT BACK THAT DATA. All of the data is important for a "Universal Encyclopedia"...we don't need people's political prejudices ruining a useful archive. Please put the data back. Thank you. Mr. Haberdasher. — Preceding unsigned comment added by 24.129.114.152 (talk) 20:00, 24 October 2011 (UTC)
Highest Disapproval Rating
[edit]This whole section is unreferenced. The article is about the Approval Rating of the President of the United States. Disapproval, while related in the sense that when approval goes up, disapproval goes down, does not belong here in the first place. It especially doesn't belong when data sourced is not from Gallup, which we have (almost unanimous) consensus, is the data that should be used. Either put in a reference for ALL the presidents from GALLUP or quit changing it. If a source isn't provided, this whole section will be removed on 9/14/2009. —Preceding unsigned comment added by 70.234.210.65 (talk) 22:32, 29 August 2009 (UTC)
I agree, however, I think if we can a get a Gallup source it should be added to the chart as well. Diamond Dave 21:24, 31 August 2009 (UTC) —Preceding unsigned comment added by David1982m (talk • contribs)
- That's fine, however, Disapproval numbers (separate from the Approval) don't really add anything meaningful to the article. High approval numbers necessarily mean low disapproval, and vice versa. Are you talking about adding a "Highest Disapproval" AND a "Lowest Disapproval" column to the chart? What about the sections? Adding a separate section or another column to the chart puts too much emphasis on the 'dispprove' aspect of approval ratings and adds nothing to the content of the article. Sometimes less is better. 70.234.210.65 (talk) 16:12, 1 September 2009 (UTC)
- The section was properly referenced to the Public Opinion Archives at the Roper Center[1]. This is as official a reference as you can get, since the Gallup site does not provide open access archives. Articles on the Gallup site are actually secondary references as the Gallup authors have to extract data from the archives, with a chance of error. I've noticed quite a few internal inconsistencies (e.g. term averages of past Presidents differ from one article to the next).
- With the reference to Roper I'd written "Click on President's names for a full report of each presidential approval ratings.", which works fine, but per your request I've now cluttered up the references with a link to each individual President's complete polling report.
- All the numbers quoted are from Gallup. Before Clinton there are only Gallup data, Clinton's worst disapproval was the 54% by Gallup, while GW Bush's worst disapproval was 77% by ARG, 76% by CNN, and 75% by Harris (3 dates). Gallup's worst of 71% comes in on a shared 23rd place.
- With respect to the "consensus on using Gallup", I was the one who implemented the "Gallup only" idea [2]. This made the last president look a lot more popular than the average poll suggested, but in the footnote I tried to explain the reason for the change. Historical comparisons are still iffy; intrinsic biases in Gallup's methods probably have changed over time, while the frequency of Gallup polls has increased from once per 6 weeks in Truman's time to once every other week for Clinton and GW Bush, to daily polls since Obama took office, with an increasing likelihood of catching peaks and valleys. It would have been best if multiple agencies had done polling since WWII, to compensate for Gallup's (possibly shifting) biases.
- The top 4 disapproval ratings have been on this page since someone introduced the top 4 lists on July 2, 2007, and for a good reason. The Gallup poll gives a third option ("no opinion"), so that disapproval does not follow directly from approval ratings. Providing only one of these can even be deceiving. For example, Gerald Ford had anemic approval ratings in the first months of 1975 (37-39%), but up to 24% of the people had no opinion, so that only 39-45% disapproved of his handling of the job. On the other hand, few had no opinion on GW Bush, reaching <0.5% in a CNN poll of December 2008.
- "Lowest disapproval ratings" do not appear to be informative. For most past presidents these were received at the first polling, when people generally don't want to judge harshly yet. This especially effected mid-term changes; for example, Ford had 3% disapproval (26% no opinion) after taking over from Nixon, and Johnson had 2% when he started (not to argue that approval rating highs and lows are only determined by a President's actions). Afasmit (talk) 09:31, 15 September 2009 (UTC)
Redundant data
[edit]Six of the eight top 4 lists in the article showed data already completely presented in the sortable table. I've integrated the remaining data in an expanded version of that table and deleted the lists. You can sort by "Highest approval" to see the presidents with the "Highest approval ratings" list combined with the "Lowest maximum approval rating during the President's time in office" list. Sort by "Lowest approval" to see the deleted "Lowest approval rating" list combined with "Highest minimum approval rating during the President's time in office". Sort by "Average approval" to see the "Highest average approval rating" combined with "Lowest average approval rating". As a bonus, presidents who consistently scored B- or C+ while at work now also show up.
Agreeing with 70.234.210.65 that Roosevelt's highs and lows should be included, I've returned him to the table. Since in the given reference Gallup is holding back on an average for him, I didn't include that (I've seen 66% on two sites). The dates were taking a lot of space, so I have reduced them to the first day of the polling. Most polls took 3 to 5 days, so there really is little information lost.
I would like to expand the "average approval" into a separate table, showing best and worst terms and best and worst years from scattered Gallup publications (most from the volumes "The Gallup poll: Public Opinion 200X; unfortunately, these are only partially accessible through google books). However, I lack some yearly averages as well as the average for Truman's first term. Gallup's method to calculate averages is not obvious to me, so I can't calculate it from the data at Roper. Perhaps someone has a good (single) source for these averages? Afasmit (talk) 09:31, 15 September 2009 (UTC)
Grid
[edit]Would it be at all possible for whoever does the graphs here to insert a grid on the Obama one. Right now its damn near impossible to line up the data with the gauge on the side. Thanks. 121.218.222.95 (talk) 22:59, 25 September 2009 (UTC)
Also, the President's graph needs to be updated. I've said that before, but I don't know how to do it on my own, so when will that be taken care of? 70.239.12.127 (talk) 18:36, 26 September 2009 (UTC)
New Obama Gallup Graph
[edit]I've created a newer, more recent graph for the President's approval rating, but how do I get it onto Wikipedia? Thanks, 76.205.80.98 (talk) 06:55, 13 October 2009 (UTC)
- Click on the graph to go to the image's page. Click on "Upload a new version of this file" on that page and follow the instructions. Afasmit (talk) 22:59, 19 October 2009 (UTC)
Is is possible to get approval data through an RSS feed? That wouldn't require people to manually load a new graph every month.Dude6935 (talk) 19:40, 26 February 2010 (UTC)
Why has Obama a different graph?
[edit]All the graphs are the same, except the one of Obama? Okay, the graph is not finished, but the past part needs to be the same as the other graphs for comparison. Crown1776 (talk) 21:01, 20 December 2009 (UTC)
I agree the graphs should be consistent, if possible. Dude6935 (talk) 23:24, 2 January 2010 (UTC)
Polls per Month
[edit]Where does Polls per Month column come from. I can't find it sourced anywhere. Assuming it is accurate (which doesn't appear to be the case - it's a daily tracking poll, the most recent past president was tracked the same way but it lists 2.9 as opposed to 29 for the current president), where do the numbers come from? And even if they are accurate and can be sourced, what significance does this number have? 76.233.113.124 (talk) —Preceding undated comment added 00:47, 19 March 2010 (UTC).
Since no one can source these numbers, I'm going to remove this column on 4/3/10 unless someone objects. 76.233.113.124 (talk) —Preceding undated comment added 21:53, 27 March 2010 (UTC).
- The polls per month is simply the number of Gallup polls divided by the number of months a president has been in office. The Gallup data is already sourced with each president and we don't need a source for doing divisions. 76.233.113.124's unawareness that daily polling only started with Obama's presidency supports the relevance of including a measure of polling frequency; again, the highs and lows are bound to be more extreme if one polls every day than, say, twice every three months, as was done for Truman. Afasmit (talk) 22:35, 27 April 2010 (UTC)
Johnson-Clinton Tie?
[edit]I don't think there's much that can be done, but I would be curious to know if there's a source out there shows the full fractional difference between Clinton and Johnson. I can imagine its not exactly 5.1 for each of them. Does anyone know of a source that shows the full rating for Johnson and Clinton that show the next few fractions that would show their differences? --Diamond Dave (talk) 23:21, 14 June 2010 (UTC)
Graphs
[edit]Looking at the graphs today, it struck me that the presentation might be better if all the graphs were drawn on the same scale, to make eyeball comparison of the slope of the approval-level line more valid. Since FDR is not included, an eight-year scale would seem appropriate. Wtmitchell (talk) (earlier Boracay Bill) 22:33, 29 June 2010 (UTC)
- I don't have a problem with that, although it seems as if it might be more work than it's worth. I don't if many people visit this page, but the comparisons are interesting and having a set scale seems appropriate. Dave Dial (talk) 23:56, 29 June 2010 (UTC)
Traffic stats says 11,080 visits in 2010-05. The work (looks like it'd be redoing the JFK, Nixon, Ford, Bush41, and Obama charts with 8-years on the X axis) would be best done by regenerating the charts from the raw data, but the charts could probably be satisfactorily photoshopped. The uploader of the earlier charts has been blocked indefinitely for sockpuppetry, but the Bush43 and Obama charts have had versions uploaded by others. Would anyone closer to this than I care to comment? Wtmitchell (talk) (earlier Boracay Bill) 01:47, 30 June 2010 (UTC)
why is Obama plot different?
[edit]Why is Obama's plot different? We need the same green-red plot, same orientation, just have some graphics person make one We need to be able to compare presidents.—Preceding unsigned comment added by 76.254.160.62 (talk) 16:55, 6 August 2010 (UTC)
Is Anyone Still Maintaining this Page?
[edit]Have there been no new polls? Since I haven't seen any new statistics for quite some time, I was wondering if the polls are no longer being done or if no one is updating this page with the most current polls. —Preceding unsigned comment added by 65.10.1.128 (talk) 03:37, 12 October 2010 (UTC)
- I updated all the polls with the current numbers today, but I'm not going to do that every day. There seems to be lots of editting when there are big changes, but Obama's numbers have been fairly steady in the mid 40's for awhile now. 99.111.226.99 (talk) 20:39, 15 October 2010 (UTC)
- Per WP:RECENT, the article shouldn't be maintained every day. Per WP:DATED, {{As of}} can/should be used to make its currency status clear. Wtmitchell (talk) (earlier Boracay Bill) 01:47, 16 October 2010 (UTC)
Why does someone keep removing his Obama's most recent lows?
[edit]His most recent low is 40% but someone keeps removing it. If you want proof here it is. http://washingtonexaminer.com/blogs/beltway-confidential/2011/07/obamas-gallup-approval-rating-hits-all-time-low-40 06:36, 6 August 2011 (UTC) — Preceding unsigned comment added by BenW (talk • contribs)
No more updates?
[edit]I was wondering why the updates on this stopped in January 2011. Also, why do all of the other presidents have an easy to read Red/Yellow/Green chart and Obama gets something different? KVP5533 (talk) 15:36, 31 August 2011 (UTC)
Edit: It appears that my questions have been asked and ignored many times before. Please continue to ignore this posting.
I understand why the graphs are different, different contributors use different reporting methods. I also realize that people just lose interest and move on and don't update things in perpetuity. I think I will look into getting the most recent Obama approval rating chart from newsweek. I am a Wiki newbie, so maybe I can do this, maybe not.... KVP5533 (talk) 16:00, 31 August 2011 (UTC)
Obama confusion and dated info
[edit]This edit caught my eye. The edit changed the "Approve" figure for President Obama for the period of Jan 31 - Feb 12, 2014 from 47.3% to 42.9%.
The supporting source cited in the article for these figures does not appear to give any information about this. It does say that the RCP average for President Obama for the period of Mar 14 to Apr 7 was "Approve" 43.2% and "Disapprove" 52.6%.
The table in the article has a third column, "+/-", and the supporting source cited appears to give no information about this (it gives information about the difference between the "Approve" and "disapprove" figures). In any case, it is not clear to me what information this column is intended to contain -- it's apparently intended as an increase/decrease figure, but it's not clear to me whether it is intended to show the change in the "Approve", the change in the "Disapprove" figure, or something else. I would guess that it is intended to show the change in the "spread" figure given in the cited supporting source but not shown in the article.
I see that the particular supporting source linked is not a date-stable source -- the page linked by the URL in the cite changes week by week. I see the following in a stable snapshot version of the currently cited source and in an older version of that source:
| snapshot date | period | approve | disapprove | spread | +/- in spread |
|---|---|---|---|---|---|
| 2014-03-14 | 2/27 - 3/12 | 43.0 | 52.9 | -9.9 | - 0.4 |
| 2014-03-01 | 2/4 - 2/27 | 43.0 | 52.5 | -9.5 | not checked |
I have not updated the RCP Average info in the article, though, because I'm not sure of the intended meaning of the "+/-" column in the table.
I took a look at the second row of the table (Rasmussen Reports), and see that it agrees with the info in the cited source for 14 Feb, and is out of date with the latesT info for 3 April. I don't see any relationship between the -1% figure reported in the "+/-" column there and any info contained in the source cited.
I took a look at the third row of the table (Gallup), and see that it reports info for February 10-12 which is not supported by the cited source currently available (the source has been updated). I haven't gone back to dig out an older version of the source. I haven't updated the table data for this row, and I wouldn't know what to put in the "+/-" column.
Could someone else please look at this? If I've somehow badly misunderstood what the article was intended to communicate here re the "+/-" table column, could someone please improve the presentation clarity here? Also, it looks to me as if the table is badly in need of updating. I would have spent more time on this, but I'm presently cursed with very balky internet connectivity. Wtmitchell (talk) (earlier Boracay Bill) 02:28, 4 April 2014 (UTC)
Obama's approval average is different in the chart (58) versus the paragraph right above (48).98.199.76.177 (talk) 22:25, 30 December 2014 (UTC)
Confusing date format in Historical comparison table
[edit]I think that the dates presented in the table at Historical comparison section is really confusing, especially for those that does not adopt the format MM/DD/YY. I suggest to just use full month name instead of the month number (as specified in MOS:DATERANGE). 116.12.221.66 (talk) 08:37, 16 June 2016 (UTC)
Can someone please add a 'Party' column to the table, just like there is on most other US Presidents lists?
[edit]Can someone please add a 'Party' column to the table, just like there is on most other US Presidents lists? — Preceding unsigned comment added by Geodem (talk • contribs) 20:19, 20 January 2017 (UTC)
Which Gallup numbers to use
[edit]The historical comparison of high and low Gallup numbers is somewhat distorted by the huge increase in polls over time. Roosevelt had one every few months, Bush II had one every week, Obama, like Trump now, had one released every day. This of course leads to wider extremes (if you try a poll 7 times in a presidents worst week rather than once, your likely to get at least once a lower approval number, same for the other end). I tried to indicate that a few years back by having a column with number of polls per year (or 4 year, or something), but that was removed nearly instantly (probably for the catch all reason of OR). Yesterday, User:Geraldbean changed the numbers for Obama to a new list of non-overlapping weekly averages, rather than the daily overlapping 3-day averages that we've been displaying for 8 years. Not surprisingly, this reduced the bottom and top numbers. Besides the lower frequency, averaging over 7 days will further smooth the edges. I'm okay with that, as the data can be sourced and it's impossible to get truly comparable data for all presidents. Perhaps people disagree though. It also emphasizes the need for a description of the numbers with each row, including for Trump which still are daily reports of 3-day averages. Afasmit (talk) 01:39, 15 February 2017 (UTC)
- BTW Obama's daily rolling 3-day averages are currently still used as a reference, if we want to keep the stepwise weekly averages this reference should be. Afasmit (talk) 20:16, 15 February 2017 (UTC)
Removing "needs updating" tag
[edit]Since there was no discussion on the talk page that seemed to relate directly to the "needs updating" tag and the charts and graphs appear both current and formatted the same as the prior presidents I'm removing the tag. In December/January the coloring of the graph was definitely different and the numbers were a little out of date. That no longer appears to be the case. aremisasling (talk) 15:52, 5 April 2017 (UTC)
Gallup
[edit]Hello, I just was reading that Gallup plans to stop doing daily tracking and instead do it weekly starting next week. [1] We should figure out how to reformat the page when this happens- keep including Rasmussen etc. Thanks
Benwitt (talk) 17:53, 3 January 2018 (UTC)
Why would this page use Gallup for historical comparison, if the margin of error is 14%? Saying the current Pres has a 40% rating, but could be as high as 54%. DeknMike (talk)
References
- ^ Frank Newport (January 3, 2018). "Changes to Presidential Job Approval Tracking and Reporting".
Benwitt removes poll from Ipsos Reuters
[edit]Why did you remove a poll from Ipsos Reuters for no reason?
Fully sourced and everything.
182.239.169.174 (talk) 01:56, 7 May 2018 (UTC)
Vandalism of Trump's Highest Approval Rating in the Table
[edit]Looks like some people are changing President Trump's "Highest Approval Rating" to 85% when the source only shows the highest at 45%. I've seen a few edits back and forth, especially with some recent news articles about the 2020 elections coming up.
Is it possible to request that row be locked, or at least require email-verified users for a bit of security on it? — Preceding unsigned comment added by Heirr (talk • contribs) 06:56, 25 February 2019 (UTC)
44 minus 35 is not 11, it's 9
[edit]It lists Trump's highest approval as 44% and lowest at 35% with a margin of 11%. 44-35 = 9 NOT 11. All good, just figured I'd better say this before anyone else sees it and uses it directly.
2600:1700:8C40:64B0:7062:5D57:9CCD:33D0 (talk) 05:01, 9 October 2019 (UTC)Sawyer
Date format in 'Historical Comparison' section
[edit]There's a tag on the article requesting the dates in this table be converted from MM/DD/YY to YYYY-MM-DD due to the former being easy to misinterpret. I've just done the conversion with an algorithm and checked it against the previous version for accuracy, so this should be complete now. (Note that if there were any typos or other inaccuracies in the original data then these will still exist. I have made no attempt to check this side of things.) If someone could review it then we could perhaps look at removing the article tag.
2001:44B8:17F:7100:F871:982B:60C5:8B67 (talk) 18:10, 27 October 2019 (UTC)
Suggesting locking this article.
[edit]There has been a vandalism campaign on this article since the house impeached. Locking the article would likely be the best course of action. — Preceding unsigned comment added by 2607:FEA8:BCA0:773:CBA:47FC:30FF:3E25 (talk) 05:39, 21 December 2019 (UTC)
- There is vandalism ongoing, as of 28 March 2020. 2001:569:BD89:A00:E576:52E6:DB6C:3D64 (talk) 10:57, 29 March 2020 (UTC)
- I agree, and can we please take the talk about Rasmussen being biased. They were accurate in most of their polls of Obama. Mentioning it makes the article sound anti-Trump.2600:1700:EDC0:3E80:D1F7:1E90:280D:FBFD (talk) 19:00, 23 August 2020 (UTC)
Heat map
[edit]Can the table be colored by value?
See Talk:Nationwide_opinion_polling_for_the_2020_Democratic_Party_presidential_primaries/Archive_3#Heat_map and Wikipedia:Village_pump_(technical)/Archive_178#Is_it_possible_to_color_table_cells_by_value_to_produce_a_heatmap? — Omegatron (talk) 01:55, 11 April 2020 (UTC)
Structure not encyclopedic
[edit]The purpose of Wikipedia is not to be a newspaper or provide political analysis and inform its readers about current affairs. The spotlight in this article is on President Trump’s approval, rather than a general focus on general approval ratings throughout different presidencies. Moreover, even if it is appropriate to include, to some extent, polling about the current presidency, the extravagant table presenting current polls should definitely be removed. 2.53.16.120 (talk) 11:07, 25 August 2020 (UTC)
Vandalism RE Trump
[edit]Someone has vandalised the article to say Trump's highest approval rating was 60% approval. Perhaps this page should be protected. 113.196.51.134 (talk) 01:39, 7 September 2021 (UTC)
I agree seeing as their has been a lot of recent vandalisms and incorrectly, unsourced, and badly formatted edits by Anonymous editors . Best suggestion would be to add an extended confirmed user protection, so that it’ll flag the system if someone without the user tag has edited, or something along the lines of that. Jerry Steinfield (talk) 07:45, 7 October 2021 (UTC)
Highest approval == Lowest Disapproval, right? (Re: Approval at the beginning of the presidency)
[edit]Shouldn't those two mean the same? I mean the lowest disapproval should be the point where the least amount of people disapprove of the president, and highest approval should also be the point at which the most amount of people approve of the president, meaning that those two would be the same, in theory, as the more people who approve, the less people do not approve, meaning disapprove. Am I reading that wrong? --Bray (talk) 23:14, 26 September 2021 (UTC)
- Not Necessarily. You can have a poll done and say the results are 60% approve, but the vast majority, if not all, of polls are not binary. So even though you have 60% approve, maybe 5% have no opinion and 35% disapprove. The same is true for the reverse where you have 60% disapprove, 5% no opinion, and 35% approve. JJN1991 (talk) 13:49, 18 January 2022 (UTC)
Approval rating by Race
[edit]I am just wondering should we start listing approval rating by Race for the president such as the approval rating by White Americans, Hispanic, Black, and Asian. They have polls by each group. It should be added. such as https://www.nationalreview.com/corner/bidens-hispanic-approval-rating-is-now-the-same-as-trumps-was-two-years-ago/ La lopi (talk) 04:59, 14 April 2022 (UTC)
- Wikipedia articles that use American English
- Wikipedia controversial topics
- C-Class United States articles
- Mid-importance United States articles
- C-Class United States articles of Mid-importance
- C-Class United States Government articles
- Low-importance United States Government articles
- WikiProject United States Government articles
- WikiProject United States articles