
Template talk:Climate chart
| This is the talk page for discussing improvements to the Climate chart template. |
|
| This template was considered for deletion on 2007 July 17. The result of the discussion was "keep". |
| Weather Template‑class | |||||||
| |||||||

As of now, the template works well in the major browsers. It's informative, especially the nice curve formed by temperature bars. It also scales very well. There are some outstanding issues:
|
|
Redundant to Infobox Weather[edit]
This template is redundant to {{Infobox Weather}}. I am going to place up for TfD. Sorry,—MJCdetroit 01:49, 17 July 2007 (UTC)
- That one is a table, this one is a chart. It's just as redundant as all infoboxes - most of the data is always in the article text anyway. Zocky | picture popups 02:21, 17 July 2007 (UTC)
Please give more information about the data[edit]
As well as giving a link to the data source, this sort of chart should include: (a) the date the weather data was accessed (eg. chart compiled in July 2007); (b) the date the source itself compiled the data (eg. data published in 2005); and (c) the date over which the data was averaged (data is the averages over 50 years from 1945-1995). All this is needed for the reader to make sense of the data, otherwise it is just a pretty picture. Carcharoth 23:38, 22 July 2007 (UTC)
- Any idea where to put those? Zocky | picture popups 16:50, 23 July 2007 (UTC)
- Down the bottom next to or in the "source" link. Imagine these charts still being used in 50 years time. There needs to be a date somewhere on the chart. Carcharoth 23:17, 25 July 2007 (UTC)
- I agree that these options should be added. If you take a look at http://en.wikipedia.org/wiki/Wenatchee,_wa you can see how I added the dates over which the data was averaged from. It would probably be better if it appeared under the "Climate chart (explanation)" part however. --ben_b (talk) 18:20, 24 March 2010 (UTC)
- Down the bottom next to or in the "source" link. Imagine these charts still being used in 50 years time. There needs to be a date somewhere on the chart. Carcharoth 23:17, 25 July 2007 (UTC)
Fahrenheit & inches[edit]
Can there be a parameter specified for whether degrees are in Fahrenheit and precipitation is in inches? It would make it a lot more user friendly for Americans. --YbborTalk 23:15, 7 August 2007 (UTC)
Units reversed in New Orleans[edit]
There seems to be a technical issue causing the Fahrenheit and Celsius readings to be swapped in the chart in the New Orleans article. Blackworm (talk) 22:08, 25 January 2008 (UTC)
Differently rendered imperial conversion chart.[edit]
In the article Kingston upon Hull the lower part of the chart (conversion to imperial units) is displayed skewed to the left of the box. This tendency shows in other articles to a lesser degree. Is there a fix, please?--Harkey Lodger (talk) 18:27, 17 February 2008 (UTC)
- Just found out--the text in the "source" field was too long.--Harkey Lodger (talk) 18:48, 17 February 2008 (UTC)
Decimals running together on precipitation section[edit]
When you have decimals on the precipitation chart, they run together making all number illegible. Is there a way we can keep the numbers legible without losing the decimal precision? Maybe round the numbers for display so that the literal data (usually copied from a source) isn't lost? -- Renesis (talk) 03:51, 7 April 2008 (UTC)
- I've reduced the size of the precipitation numbers somewhat. Also, all precipitation numbers larger than 10 are now rounded to 0 places, and those smaller than 10 to 1 place. This should hopefully fix most problems. Zocky | picture popups 13:08, 19 September 2008 (UTC)
well done[edit]
this template is fantastic. well done to all involved. 203.212.129.240 (talk) 15:29, 10 August 2008 (UTC)
I am having a problem with the chart for Brownsville Texas. It seems to be pushing all the high temperatures below the bars, and then they get crowded over the low temperature bars. Have left my example on the sandbox page. 25or6to4 (talk) 16:45, 7 October 2008 (UTC)
I had the same problem with the charts of three different cities. The reason was that I had reversed the order of the high and low temperatures. When I put the lows before the highs, the charts displayed properly. Erutuon (talk) 20:11, 22 October 2008 (UTC)
Add "hours of sunshine" and annual averages[edit]
This is a very nice template. It would be even better is would accommodate an additional segment on "hours of sunshine". Also a possiblity to show annual averages would be welcome. See for example the data in Netherlands#Climate. −Woodstone (talk) 21:37, 2 January 2009 (UTC)
- And mean number of rain days per month, as per [1] for instance. Really useful when planning trips and the such ;-) —Preceding unsigned comment added by Rdavout (talk • contribs) 16:26, 26 May 2009 (UTC)
- I agree with the annual averages part not so much hours of sunshine. That is hard to collect and can be defined in various ways. Mean number of rain days might be usefully however chart will get crowded quickly.
Which weather template[edit]
There's a discussion at Template talk:Infobox Weather#This template or template:Climate_chart about the use of {{Infobox Weather}} vs. {{Climate chart}} which both present the same kind of data but in completely different formats. If anyone here has reasons one of these should be preferred over the other please comment (there, not here). Thanks. -- Rick Block (talk) 03:38, 9 January 2009 (UTC)
Record temperatures and precipitation.[edit]
Can someon design another chart with 3 more parameters per month: record high temperate, record low temperate, maximum precipitation? Example: [2]. -- Jeandré, 2009-02-20t13:30z
- This would be nice and the concept shown here works pretty good. --ben_b (talk) 18:29, 24 March 2010 (UTC)
Style and HTML changes[edit]
I made some initial changes to this template to (a) bring it inline with the expectations of our other templates, including the use of appropriate HTML classes) and (b) clean the code up so that it is more readable and hence maintainable. The current version is in the sandbox; comparison between the old and new layouts is in the new test cases page. Amongst other changes, the use of a defined HTML class affords the template an inherent floating ability and margins which better set it off from the article body. Chris Cunningham (not at work) - talk 14:59, 20 July 2009 (UTC)
- As there's been no further input, I've synced the live template with the sandbox. Chris Cunningham (not at work) - talk 11:13, 30 July 2009 (UTC)
- What about the discussion on my talk page? That issue has not been resolved and until I can see a clear reason for making it wider, I will keep the infobox the same width. Making it wider has serioues layout issues on many articles. It doesn't need to be made wider. Jolly Ω Janner 14:10, 30 July 2009 (UTC)
- I've already indicated that I can't reproduce the issue on your talk page. Furthermore, I find it very difficult to believe that a difference of ~10 pixels in the worst case causes "serioues layout issues on many articles". Chris Cunningham (not at work) - talk 14:27, 30 July 2009 (UTC)
- The text is smaller and thus more difficult to read. I cannot see any improvements in the new version. Is it possible that its width is caused because you set its "style="infobox". Maybe infoboxes are set to a standard size and that is why it's made biggers. I cannot explain the smaller text though. Jolly Ω Janner 15:24, 30 July 2009 (UTC)
- That's correct. There are a standard set of font metrics for templates like this, and we should be using them. Instead, we're sticking to some arbitrary other styling, for what appears to be no better reason than personal preference. As this both makes them template less integrated into the project as a whole and harder to maintain, we should just go with the standard styling. Again, I'd far rather see some concrete evidence that the proposed version causes problems in existing articles than a vague assertion that it does which I can't reproduce. Chris Cunningham (not at work) - talk 22:21, 30 July 2009 (UTC)
Here's for before and after on climate of south-west England
-
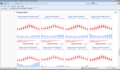 Before
 -
 After
After


![[2]](http://s5.tinypic.com/280ulaa.jpg)
I think the text is too small and will be difficult to read. As you can see on the old version, the size of the text is not causing any problems (it all fits into the chart). I also think the gaps are too great between the columns and decreases the ability to see a pattern/curve. Jolly Ω Janner 22:42, 30 July 2009 (UTC)
- These can certainly be tweaked, and I hope to continue working on the template to address any further issues, but they aren't showstoppers. I'll have a look into increasing the font size. Chris Cunningham (not at work) - talk 08:31, 31 July 2009 (UTC)
- Very importantly, the height of the template mustn't be (too) dependent on the name of the place that the climate chart is for. In my browser that e.g. happens in the South West England article, and it causes the charts to be laid out seemingly haphazardly on the page with big white holes between them. This obviously won't do, so we need the <br> before the name of the place back. Zocky | picture popups 19:27, 31 July 2009 (UTC)
- I've split the title into two rows and tweaked the font metrics a bit. Comments? Chris Cunningham (not at work) - talk 12:20, 4 August 2009 (UTC)
- I find today's changes quite ugly, and think the new text looks huge. Look at what you've done to articles that use Imperial units, like Louisiana. I worry editors are only looking at specific English pages. This should have the same size text as infoboxes or navboxes, which is small. If this is too small for you, I suggest you change the text size on your browser. The chart is useful because it is compact, and I didn't find it hard to read before.-- Patrick {oѺ∞} 18:58, 4 August 2009 (UTC)
- I'm no expert on the climate of Louisiana, but I'm sure that it rains there at least once a year. Why is the climate chart not showing this? Also, I think if you're going to display four climate records, then the table version of climate data would be better. This template shouldn't be used on either side of the text. Jolly Ω Janner 19:21, 4 August 2009 (UTC)
| Anchorage | ||||||||||||||||||||||||||||||||||||||||||||||||||||||||||||
|---|---|---|---|---|---|---|---|---|---|---|---|---|---|---|---|---|---|---|---|---|---|---|---|---|---|---|---|---|---|---|---|---|---|---|---|---|---|---|---|---|---|---|---|---|---|---|---|---|---|---|---|---|---|---|---|---|---|---|---|---|
| Climate chart (explanation) | ||||||||||||||||||||||||||||||||||||||||||||||||||||||||||||
| ||||||||||||||||||||||||||||||||||||||||||||||||||||||||||||
| ||||||||||||||||||||||||||||||||||||||||||||||||||||||||||||
- Louisiana was likely a bad example. The point is that as of yesterday, you changed the font size for all charts using Imperial units. Check out the Anchorage example chart from the Doc page and then try Virginia, Jacksonville, Texas, or Manchester, New Hampshire. Is it just me?-- Patrick {oѺ∞} 23:30, 5 August 2009 (UTC)
- I can see the change in font too, but all I did was change what the text says. Look for yourself. I didn't change the font at all. Jolly Ω Janner 01:36, 6 August 2009 (UTC)
Minor changes[edit]
I would like the Key to not be colored, as it makes them look like links, Perhaps a small colored box could be provided? Second I'd like "metric conversion" to be titled simply "Metric Units" (and the same for Imperial). Anyone agree or disagree? -Ravedave (talk) 03:47, 18 September 2009 (UTC)
- A small colored box legend could do (but I'd really have to see it—I'd rather not add complexity to an already busy diagram). I agree with your 2nd point for "Metric units". +mt 06:10, 24 September 2009 (UTC)
Link to explanation?[edit]
The Template:Climate chart#How to read a climate chart explanation does a nice job of telling folks how to understand these charts. I think we should extract it from there into a separate page and link it to something in the chart (e.g., "Climate chart" near the top of the box). That will ensure that anyone who doesn't understand the chart will have access to the explanation. RossPatterson (talk) 14:59, 1 January 2010 (UTC)
 Done Any comments? Jolly Ω Janner 16:15, 1 January 2010 (UTC)
- Looks nice, thanks! RossPatterson (talk) 16:43, 1 January 2010 (UTC)
Problems in IE 8[edit]
The climate chart sometimes does not display properly in IE 8 (just shows a blank space where the chart should be). I noticed it first at Northwich. I believe it may be ultimately the same problem with IE and/or the HTML that Wikipedia is generating as is described at Template talk:Location_map#Map does not work properly in IE. There is something that is not working properly with dynamically generated graphical content. 86.134.55.215 (talk) 00:10, 2 February 2010 (UTC).
- It happens sometimes to me on Internet Explorer 8. Most of the time it's fine. I have no idea why it sometimes happens, though. Doing a hard refresh (Ctrl+ F5) somtimes helps. The one on Northwhich works fine for me. Jolly Ω Janner 01:19, 2 February 2010 (UTC)
- Northwich is now working OK for me too. Yesterday it consistently failed. Today it consistently works. Tomorrow, who knows. I've noticed this with the other related problems too. The behaviour is not reliably reproducible. 86.136.194.75 (talk) 14:37, 2 February 2010 (UTC).
Capitalization[edit]
I recently applied this template to an article, and it was suggested to me that the words "average", "precipitation" and "source" which appear below the chart should be capitalized, and I think that's correct. Any thoughts on that? Omnedon (talk) 06:04, 23 January 2011 (UTC)
Negatives[edit]
It was pointed out to me recently that when displaying negative values, this chart uses Unicode U+002D, a hyphen. It probably should be using Unicode U+2212, the minus sign, per Wikipedia:Manual_of_Style#Common_mathematical_symbols. Is that right? Any thoughts? Thanks. Omnedon (talk) 14:45, 6 February 2011 (UTC)
[edit]
High tempratures not displayed correctly[edit]
I just put the template up on the page for Agra and the average temp. which touches 42C in May is overlapping with the text for the month... is there any way to fix it? Madhav (talk) 04:33, 9 May 2008 (UTC)
- Same issue occurs for Manitouwadge but on the other end of the scale, in the winter. Perhaps a height variable of some sort should be introduced...? Thorlius (talk) 16:42, 24 September 2008 (UTC)
- Same issue occurs for Vostok Station on the lower end. The graph doesn't look serious due to very low temperatures (down to -104). The temperature chart goes below the box of the chart, overlapping rest of document. —Preceding unsigned comment added by 83.134.0.76 (talk) 21:35, 29 July 2009 (UTC)
- Where are we at with fixing this? Essecially with the Vostok Station climate chart it makes it completely pointless. Either the template needs to auto scale or a height option should be added. --ben_b (talk) 18:25, 24 March 2010 (UTC)
Cold temperate problems[edit]
Please take a look at Iqaluit#Geography. The temperatures in the winter cover the precipitation. something lame from CBW 22:10, 17 April 2010 (UTC)
Size setting[edit]
Perhaps the size or scale should be configurable. See Cherrapunji Shyamal (talk) 03:11, 19 September 2010 (UTC)
Very low tempertatures[edit]
Hello everyone!
On the Verkhoyansk article, the very low winter temperatures are rendered above the rainfall and legend. Could anyone fix that?
Regards,Calimo (talk) 15:10, 18 October 2011 (UTC)
- This seems to be a generic scaling problem, several reports in the past. I have grouped the ones I could spot into a single section. Someone with template knowledge needs to look at this. Shyamal (talk) 06:29, 19 October 2011 (UTC)
- Looks like the precipitation chart needs more padding above it, enough to account for 30 additional degrees. Bob the WikipediaN (talk • contribs) 17:12, 19 October 2011 (UTC)
Collapse[edit]
Would you be willing to make these collapsable?Alanscottwalker (talk) 18:05, 9 November 2011 (UTC)
hide option[edit]
make this more competitive with infobox weather by adding a 'hide' option for the entire chart. ---华钢琴49 (TALK) 01:44, 6 May 2010 (UTC)
"Imperial" units[edit]
The United States does not use Imperial measure, that system having been introduced in the British Empire in the nineteenth century, well after the U.S. became an independent nation. The generally accepted name for the customary system of units in the U.S. is "United States customary" measure. (Granted that the difference between the two systems, which is primarily in the units of volume, does not involve the units being used here -- but there is still the matter of naming.) Is there any part of the former British Empire that still uses Imperial measure for weather reports? All of the Commonwealth countries I am familiar with have used metric measure in weather reporting for decades now. 121a0012 (talk) 19:01, 22 September 2012 (UTC)
- Yes, I saw imperial units and thought, what's that?
- Other common ways of referring to these systems in the United States are: "Standard," "Customary," or, somewhat erroneously when considering volume/tonnage, "Imperial," or "English," which refers to the pre-1824 reform measures used throughout the British Empire.
- See United States customary units#Other names for U.S. customary units --Dejitarob (talk) 03:40, 3 October 2012 (UTC)
Freezing line incorrectly displayed too low[edit]
Just added one of these nifty climate charts to the Asheville page. For some reason though the grey horizontal line that denotes freezing temps is displaying too low. You can clearly see the low temps for the winter months of Jan, Feb, and Dec are 27, 30 and 30. Even though these are below freezing they are displaying above the freezing line. Any idea what gives? --Dejitarob (talk) 03:28, 3 October 2012 (UTC)
Example using data from Beaver Creek, Yukon[edit]
Climate chart for Beaver Creek, Yukon
| ||||||||||||||||||||||||||||||||||||||||||||||||||||||||||||||||||||||||||||||||||||||||||||||||||||||||||||||||||||||||||||
|---|---|---|---|---|---|---|---|---|---|---|---|---|---|---|---|---|---|---|---|---|---|---|---|---|---|---|---|---|---|---|---|---|---|---|---|---|---|---|---|---|---|---|---|---|---|---|---|---|---|---|---|---|---|---|---|---|---|---|---|---|---|---|---|---|---|---|---|---|---|---|---|---|---|---|---|---|---|---|---|---|---|---|---|---|---|---|---|---|---|---|---|---|---|---|---|---|---|---|---|---|---|---|---|---|---|---|---|---|---|---|---|---|---|---|---|---|---|---|---|---|---|---|---|---|
| ||||||||||||||||||||||||||||||||||||||||||||||||||||||||||||||||||||||||||||||||||||||||||||||||||||||||||||||||||||||||||||
Above is a chart filled in for Beaver Creek, Yukon, using the data already in the article as of 04:29, 4 October 2012 (UTC). Its winters are cold, so for this template to generated a usable chart for its climate data, some sort of optional parameter for shifting the red bars up is needed. As should be apparent, when a place is as cold as Beaver Creek, the warmest templates are low enough that the current implementation leaves plenty of room to allow for some way to shift the red bars up. Anyone interested in implementing such a shift option? 72.244.204.87 (talk) 04:29, 4 October 2012 (UTC)
- I posted about this at WP:Requested templates#Climate chart template needs a new parameter. 72.244.204.87 (talk) 04:42, 4 October 2012 (UTC) P.S. In case this display problem is web browser-specific, I am using the version of Gecko (layout engine) that comes with Mozilla Firefox 15.0. 72.244.204.87 (talk) 04:50, 4 October 2012 (UTC)
- I just checked the source code, this has to changed in multiple templates:
- In the second line. I will try to include another parameter this weekend so that the user is able to change the line... mabdul 15:36, 9 November 2012 (UTC)
Unequal bands[edit]
The red bands for temperature are narrower than the blue precipitation. It looks a bit odd. Can they be made equal? John of Cromer in China Philippines (talk) mytime= Tue 20:43, wikitime= 12:43, 5 February 2013 (UTC)
Weather box[edit]
Discussion started at Wikipedia_talk:WikiProject_Cities#Weather_box on the use of Template:Weather box in articles. SilkTork ✔Tea time 16:41, 29 April 2014 (UTC)
Display negative temperatures in different color[edit]
Perhaps something like the following could be added (check the source code of this, the new '#ifexpr {{{1}}} < 0' pieces):
<div style="overflow:hidden;background:{{#ifexpr: {{{1|10}}} < 0 and {{{2|20}}} < 0|blue|red}};-webkit-print-color-adjust: exact;color-adjust: exact;position:absolute;left:.4em;width:0.8em;bottom:{{#expr:{{{1|10}}}/5+8}}em;height:{{#expr:({{{2|20}}}-{{{1|10}}})/5}}em;"> </div> ... <div style="color:{{#ifexpr:{{{2|20}}} < 0|blue|red}};position:absolute;bottom:{{#expr:{{{2|20}}}/5+8}}em; left:-.4em;width:1.6em;height:1.5em;text-align:right"><span style="font-size:80%">{{#ifexpr:({{{2|20}}} round 0) < 0|−}}{{#expr:abs({{{2|20}}} round 0)}}</span></div> ... <div style="color:{{#ifexpr: {{{1|10}}} < 0|blue|red}};position:absolute;bottom:{{#expr:{{{1|10}}}/5+6.5}}em; left:-.4em;width:1.6em;height:1.5em;text-align:right"><span style="font-size:80%">{{#ifexpr:({{{1|10}}} round 0) < 0|−}}{{#expr:abs({{{1|10}}} round 0)}}</span></div>
It displays negative values (both bars and numbers) in blue, instead of all red. Thoughts? Andree.sk (talk) 18:09, 8 August 2018 (UTC)
Added coloured boxes to the legend[edit]
They seemed to be missing; I haven't "committed" anything yet, but left it on the sandbox - see diff at /testcases. Thoughts?—Jon (talk) 04:08, 31 May 2022 (UTC)
- @TheDJ: Hi - as someone who recently edited this template, I wonder if you have an opinion about adding a legend? It seems there's been little activity here otherwise. I'm no expert, but I've had a go on the sandbox. Since May, I've also thought that maybe the legend text could be normal colour, as it's all a bit "jazzy" and possibly unnecessary if we have coloured legend boxes instead.—Jon (talk) 21:51, 11 December 2022 (UTC)
Delete the space after "Source:"[edit]
Greetings and felicitations. The "Source:" field has a space after its output, as in Clark County, Nevada#Climate. This goes against the principle of MOS:CITEPUNCT. Would someone please be so kind as to remove that space, as I'm afraid I myself cannot figure out how. — DocWatson42 (talk) 06:13, 13 March 2023 (UTC)
| Clear = ?[edit]
Can someone tell me what (Clear = ) actually does? I couldn't understand it from the page.PAper GOL (talk) 17:23, 4 July 2023 (UTC)
Module version[edit]
I've made a module version of this template, just to get it advertised. There's a bit more work to do involving the layout options (float/clear), which I do intend to restrict a bit from where they are today.
Also, as you can see in Template:Climate chart/sandbox, this version corrects at least one error when a value is missing but makes the missing value non-obvious to the user without close inspection of the values in the table and/or knowledge of the default. Is there a desire to adjust that behavior? Izno (talk) 22:40, 26 July 2023 (UTC)
- I have made this live. I do think a warning is probably correct to emit but it can be done in a separate context or as a category. Izno (talk) 00:20, 1 March 2024 (UTC)
Order = flip?[edit]
Would it be possible to add an order=flip parameter to this template like Template:Convert, so one can enter the data in SI units, but still have the Imperial units be the primary display, or vice versa? Or perhaps for this template it would make more sense to add a data_units parameter, which defaults to the same as units. I encountered a situation where the data was in SI units for an article about a U.S. location, so I had to convert it all to get Imperial units to show up first. –CWenger (^ • @) 16:44, 20 August 2023 (UTC)
"Imperial conversion" headers are misaligned on mobile[edit]
The month headers under Imperial conversion are misaligned (squeezed to the left) on Fennec 116.3.0. 62.98.162.23 (talk) 15:50, 9 September 2023 (UTC)
It seems a recent change is causing negative temperatures to be shown incorrectly unless they have a specific type of formatting[edit]
@Izno: A large amount of climate charts had become broken by the latest changes to the template. The problem seems to be about formatting and negative temperatures. I've reverted your changes to the template, the problems seem to have disappeared. For an example of a climate chart that became bugged with the new changes, see the Shenyang climate chart in Humid continental climate. Uness232 (talk) 05:27, 4 March 2024 (UTC)
- What was the specific issue? Izno (talk) 05:51, 4 March 2024 (UTC)
- @Izno In some negative values, the values would reset to 20C to 10C depending on how the negative values were formatted. Recent changes on Mediterranean climate were also trying to resolve this issue. Uness232 (talk) 06:41, 4 March 2024 (UTC)
- I have copied the Shenyang example to the test cases page. It's always good to have edge cases on the test cases page for future development. – Jonesey95 (talk) 16:35, 6 March 2024 (UTC)
- @Uness232, as I expected, someone plugged in actual
−into the inputs rather than the more typical hyphen-minus. The template handles display of minus signs automatically. I will need to look again but I am pretty sure I ported the template to Lua faithfully on this point. - I also discovered a rounding issue too it looks like for negative numbers that are halves which round positively rather than negatively (−16.5 rounds to −16 currently in the sandbox, −17 in the live), so I'll have to see about that. Izno (talk) 17:34, 6 March 2024 (UTC)
- @Izno In some negative values, the values would reset to 20C to 10C depending on how the negative values were formatted. Recent changes on Mediterranean climate were also trying to resolve this issue. Uness232 (talk) 06:41, 4 March 2024 (UTC)