
Talk:Carbon dioxide in Earth's atmosphere/Archive 1
| This is an archive of past discussions. Do not edit the contents of this page. If you wish to start a new discussion or revive an old one, please do so on the current talk page. |
| Archive 1 | Archive 2 |
Poor Sentence Construction
The following sentences need to be rewritten. " These timescales are so short with respect to the timescale of the evolution such there is little doubt these concentrations will be reached soon barring any drastic behavior changes.[citation needed] Indeed, the lifetime of for instance power plants can be 40 to 60 years.[32] To avoid these concentrations, an immediate reduction of the concentration growth of 3.5% per year rather than a growth of the concentration growth of 1.7% per year needs to be achieved for the foreseeable future." — Preceding unsigned comment added by 75.27.121.68 (talk) 23:30, 31 August 2011 (UTC)
Concentration - Global Warming Statement
You state that "Increased amounts of CO2 in the atmosphere tend to enhance the greenhouse effect and thus contribute to global warming.". This is a theory, not a proven fact (albeit a much hyped theory). Could you make that clear, please?
It's also a "theory" that the sun will rise tomorrow.24.47.61.206 (talk) 02:25, 10 November 2011 (UTC)
Jqlr 12:05, 8 June 2007 (UTC)
- I tried to make it more neutral and linked it to the appropriate page. Sln3412 22:14, 19 June 2007 (UTC)
The statement that "Increased amounts of CO2 in the atmosphere tend to enhance the greenhouse effect and thus contribute to global warming.", is really misleading.
No it isn't. While water vapor is more abundant, significant (10%) increases in C02 will certainly produce significant warming. Of course one might argue that a 3 degree celsius increase in temperature, converted to degree Kelvin, would be "insignificant'. But it's certainly significant compared to the normal range of temperatures, and in terms of biological and even geological effect. One might equally argue that running a high fever is "insignificant".24.47.61.206 (talk) 02:25, 10 November 2011 (UTC)
To fairly represent the potential of CO2 as a greenhouse gas for all non technical readers of this article, this article should mention the fact that on average, CO2 atmospheric concentration constitutes a very small overall percent of total greenhouse gas. To better explain my point. H20, "on average" exists in the "troposhere" in the 1.5% to 3.0% levels or (15,000 ppmv to 30,000 ppmv) range. (http://www.netl.doe.gov/KeyIssues/climate_change3.html) Even if all other greehouse gases are ignored, CO2 concentrations of 400 ppmv when compared only to water vapor would represent only 2.7% to 1.3% of all of the greenhouse gas. This is a key issue since CO2 and H2O both absorb IR energy in the 2.7 and 15 micron spectra. Therefore, most of the IR energy which is reflected from the earth in these two IR spectra will be absorbed by H2O. The only spectra att which CO2 uniquely absorbs IR energy is a narrow band centered at 4.7 microns. http://brneurosci.org/co2.html
I think that this statement would most accurately represent reality if it were restated to read as follows:"Since H2O, the most powerful greenhouse gas, exists at concentrations which are 40 to 70 times greater than CO2, increasing CO2 would slightly enhance the greenhouse effect which could contribute to global warming." —Preceding unsigned comment added by Beegdawg007 (talk • contribs) 19:02, 19 January 2010 (UTC)
- Well, no. See Talk:Global warming/FAQQ14. --Stephan Schulz (talk) 19:57, 19 January 2010 (UTC)
In a similar vein, the following statement needs a lot of work "The Northern Hemisphere dominates the annual cycle of CO2 concentration because it has much greater land area and plant biomass than the Southern Hemisphere. Concentrations peak in May as the Northern Hemisphere spring greenup begins and reach a minimum in October when the quantity of biomass undergoing photosynthesis is greatest.[3]". A lot of research has been done on the atmosphere/ocean carbon flux, and there is abundant research showing seasonal temperature drives the cycle. The Southern hemisphere has vastly more heat-moderating ocean and reflective ice surface than the north which has more absortive land mass. It's not only the northern growing season that is in sync with the seasonal CO2 cycle - the average temperature of the globe is in sync with seasonal CO2 as well. A lower average global temperature causes the ocean to absorb more CO2. In either case, the sun is the cause of the CO2 fluctuation. But for balance in the contentious climate-change debate, it is relevant to point out that this is a natural phenomenon where temperature drives CO2 levels rather than the reverse. —Preceding unsigned comment added by 115.64.6.58 (talk) 02:25, 19 July 2009 (UTC) global warming is from mndg; —Preceding unsigned comment added by 86.163.43.190 (talk) 16:19, 14 June 2010 (UTC)
Concentration - figures and reference
The references for this aren't very good, neither one lists the % by weight nor the number of tonnes. What "pre-industrial" is isn't defined either. Obviously, that's supposed to be an average of 228 - what years were the average 228?
As of January 2007, the earth's atmospheric CO2 concentration is about 0.0383% by volume (383 ppmv) or 0.0582% by weight.[1] This represents about 2.996×10¹² tonnes, and is estimated to be 105 ppm (37.77%) above the pre-industrial average.[2]
Sln3412 22:18, 19 June 2007 (UTC)
- In fact, I don't know why the weight is important for a gas. I think the weight can be dropped and only ppm by volume used. --Sln3412 22:44, 19 June 2007 (UTC)
alexselkirk1704 suggests; More could be said about the natural mechanisms that remove carbon dioxide from the atmosphere and some estimates of its duration therein.
Image Issues
Hey guys... The graph that starts at 1960 to the present is horribly biased and obviously trying to push an axe to grind (an agenda...) Could you guy please uphold Wikipedia's reputation of being credible by getting a graph that more accurately describes the trends of global warming? Starting the graph at 1960 makes the increase in CO2 seem much larger than it is relative to the Earth's holistic history...—Preceding unsigned comment added by 144.92.123.190 (talk • contribs) 18:21, 13 December 2007
- but the observatory only started monitoring CO2 in 1957. I don't think that's bias, it's just a graph of what the CO2 is at? Further down the page there's a graph of CO2 over the last 400,000 years (much of the Pleistocene) and one of the last 500M years or so too... I'm not sure why mentioning current CO2 levels is 'bias', seems quite a reasonable thing to include. 129.215.24.8 (talk) 16:39, 23 June 2008 (UTC)(lionfish)
- The article is about Carbon dioxide in the Earth's atmosphere, not Carbon Dioxide rise in the past 50-60 years. I agree that the graph as presented is biased.216.13.37.10 (talk) 16:34, 1 October 2009 (UTC)
- The graph (mauna loa) is the most accurate measurement of CO2 that exists, it starts at that point because that is the starting point of direct measurements (as opposed to proxy data). Any apparent "axe to grind" is in the eye of the beholder, rather than in the graph. --Kim D. Petersen (talk) 16:57, 1 October 2009 (UTC)
Relationship with oceanic concentration
"The vast majority of CO2 added to the atmosphere will eventually be absorbed by the oceans and become bicarbonate ion, but the process takes on the order of a hundred years because most seawater rarely comes near the surface."
That last part can't be true for two reasons. First the churning of the sea surface mixes atmospheric gases with the water quite well. We know this because sufficient oxygen gets into sea water to support life- especially in the top 100 meters or so. Second there is rain. Time to do a little back of the envelope calculation. Let average rainfall per year be 200mm over the entire surface of the globe. So the volume of water that washes the atmosphere in one year is: pi*D^2*200mm=3*8000*8000*5280*5280*300*300*200mm^3=10^23mm^3. Let an average raindrop be 1mm in diameter, so its volume is .5mm^3. So the number of rain drops that fall in a year is 10^23/.5=2*10^23. And the total surface area of all the raindrops that fall in one year is 2*10^23*3*1^2=6*10^23mm^2. Finally, how many times larger is this number than the entire surface of the globe? The Earth's surface area is 5*10^20mm^2, so one years worth of rain presents a water to atmosphere surface that is 6*10^23/(5*10^20)=1000 times the surface area of the Earth. That sounds like plenty of opportunity for trapping co2 to me. We then assume that amount of co2 that enters each raindrop is a modest .001 by weight (although the major path for disolution may be in the formation of the raindrops), (1cc is one gram) so 10^20gm*.001=10^17grams of CO2=10^14kg=10^11metric tons, which compared with 3*10^12metric tons of co2 in the atmosphere, means 3% of atmospheric co2 is removed from the atmosphere by rain every year. And it also means that, effectively, all atmospheric co2 is cycled out of the atmosphere every 33 years. Of course there still is the ocean surface, which can probably be considered to be in equilibrium with the atmosphere at the surface, so movement either way is likely to be balanced. An of course, I used one tricky number (part by weight absorption) that easily could be way off and could dramatically effect the calculation. blackcloak (talk) 08:48, 18 January 2008 (UTC)
- CO2 (a nonpolar gas) is only poorly miscible in water (a highly polar solvent). For sea water the result is ~90 mg/kg, or 90 ppm by weight. So it is likely your guess for the amount of CO2 in rain is too high by more than an order of magnitude. Further, isotopic and mass balance studies suggest about 11 gigatonnes CO2 shifts from the atmosphere to the ocean per year under current conditions, rather than the 100 gigatonnes you suggest.
- Also, even if your analysis were correct, Wikipedia's policy on original research requires that analysis be previously published rather than our own interpretations. Dragons flight (talk) 10:06, 18 January 2008 (UTC)
- While you are right about the policy, in practice what happens is wiki authors describe their interpretation of what they read in published material, and they often get it wrong, especially as they dumb it down. I'm convinced that many wiki authors are not well trained hard scientists, and easily fall into traps about definition and logic. blackcloak (talk) 06:56, 1 May 2008 (UTC)
- In this case, back of the envelope calculations are done as sanity checks, not as original research. There are several respects with which my numbers could be wrong. I have not seen any published work that specifically says that rain is not a significant factor in the removal of CO2. So using your number (.0001 for seawater, instead of my guess of .001 for rainwater) for the ratio by weight, my computed estimates correspond quite closely to your numbers. But the question that has to be asked is: Is rainwater significantly different from seawater when it comes to CO2 concentration? I can imagine that rainwater strikes the oceans at pH 5.7, along with its load of CO2, mixes with the top layers of the ocean during the rain storm, then is slowly dissipated back to the atmosphere as equilibrium is returned to the seawater/atmosphere boundary. Of course some of the CO2 would stay, feeding life in the upper layers, a proportion of which is then captured in solid form and falls to the ocean floor. blackcloak (talk) 07:13, 22 January 2008 (UTC)
Erroneous Comparisons
The differences between the 1832 ice core and the more recently determined Mauna Loa atmospheric concentrations of carbon dioxide should not be used to argue for or against any trends. Mauna Loa is a subtropical to tropical volcanic island over a major oceanic hot spot that is releasing gases into the ocean and into the atmosphere. We've been measuring the carbon dioxide atmospheric changes in this area for only 48 years, hardly long enough to know if it is part of a multidecadal, or multicentury cycle involving oceanic or wind currents, varying vulcanism in the earth's crust, or to some other yet unknown or undiscovered factors. The ice core comes from an environment most likely devoid of carbon dioxide producing vegetation at a much higher latitude with insignificant vulcanism in the vicinity. Furthermore, the water temperatures are different in these enviroments. The amounts and types of precipitation are different as well. In my opinion, comparing atmospheric carbon dioxide concentrations in these very different environments as if they represented some 180 year trend for the entire earth, goes way beyond ludicrous.
This entire article doesn't pass my credibility test and, in my opinion, should be removed from Wikipedia.
Norm (talk) 03:27, 8 February 2008 (UTC)
- CO2 is globally well mixed, in general William M. Connolley (talk) 08:14, 8 February 2008 (UTC)
- Since CO2 is about 50% more dense than the vast majority of the molecules of the atmosphere, in principle, it should slowly sink towards the earth. It seems reasonable to conjecture that there is a CO2 density profile with the greatest concentration at the surface of the earth. Has anyone published mearsuremnts that might confirm this trend? blackcloak (talk) 04:53, 27 February 2008 (UTC)
- You may have noticed the weather. The stirring of winds and large scale convection totally overwhelm density driven seperation. And yes, CO2 profiles have been measured versus altitude. Dragons flight (talk) 18:45, 27 February 2008 (UTC)
- Look at the graph. If what you say is true you would not see anything so consistent from year to year, in both yearly fluctuations and yearly upward trend. If volcanoes in fact biased the measurements on Mauna Loa, as you suggest, then you'd see lots of yearly fluctuations. Furthermore, if CO2 had a vertical concentration gradient, which it doesn't to any significant degree, then if anything the measurements on Mauna Loa would underestimate its concentration because it is on a mountain.--Kram-bc (talk) 06:51, 12 March 2008 (UTC)
Concentration Metric
This sentence from the Concentration section of the article just doesn't make sense: The National Oceanic and Atmospheric Administration describes current levels "...as a dry mole fraction defined as the number of molecules of carbon dioxide divided by the number of molecules of dry air multiplied by one million (ppm).
Maybe it should say The National Oceanic and Atmospheric Administration defines concentration as "...as a dry mole fraction defined as the number of molecules of carbon dioxide divided by the number of molecules of dry air multiplied by one million (ppm).
Even then it's self referential since normal dry air contains carbon dioxide, so may be it should be normal dry air less the carbon dioxide content - in any case it's just inconsistent as is. Unfortunately I don't know enough to make a correction. Furthermore other sections refer to concentration by volume, which is fine so long as the implicit assumption of the ideality of carbon dioxide and other components of air is taken as read, which one shouldn't have to do.Fizzackerly (talk) 15:14, 17 March 2008 (UTC)
- I rephrased it to what I think it means, roughly equivalent to your version. I don't see why its self-ref though... dry air is (not-CO2)+(CO2) and the fraction is (CO2)/((not-CO2)+(CO2)). Since the not-CO2 bit is pretty constant, this seems OK. CO2 is only 0.04%, so it wouldn't matter much if you did CO2/not-CO2 William M. Connolley (talk) 18:58, 17 March 2008 (UTC)
how much ppm can atmosphere take + amount of daily emissions by man
please add the quote that we are putting 70 billion ton co2 in the atmosphere daily (see the an inconvenient truth film; or refer to http://www.climatecrisis.net/ and mention how much the atmosphere can still take before there are very serious consequences (I believe the IPCC mentioned around 500 ppm). This data would also allow a graph based on "business as usual" to see how long we can still continue our emitting at present levels before there are bad things to happen (500-present level= ? -70 ton co2 x 356= ? year; this can be shown on graph)
thanks, 81.244.207.221 (talk) 12:00, 3 August 2008 (UTC)
- The actual number is closer to 70 million ton of CO2 daily. 70 billion would make for more than 10 ton per capita, which is a bit much. 10 kg daily per capita is about right. Pierre-Normand (talk) 02:23, 26 January 2010 (UTC)
deceptive phrasing
"Biologically, plants and other photoautotrophs extract carbon from the atmosphere in the form of carbon dioxide by the process of photosynthesis and use it as an energy source" This sems to suggest that plants use carbon dioxide as an energy source, which of course is false. The energy source is sunlight, and the photosynthetic process achieves chemical marvels in creating carbohydrates which are the primary energy source to so much of the biosphere. The quantity of solar energy required per Joule of chemical energy so captured is quite prodigious. I suggest the wording ...phototrophs, using the energy of the sun, capture carbon dioxide from the atmosphere, and their photosynthetic chemistry converts it with water from their roots, create carbohydrates to use as an energy source" DaveyHume (talk)
"These natural sources are balanced by natural sinks, which remove carbon dioxide from the atmosphere.[8] The increase in carbon dioxide concentration arises because the increase from human activity is not balanced by a corresponding sink."
The over-simplified explanation above leads to misunderstanding, in two respects. 1) Natural processes do not remove all co2 from the atmosphere. Natural processes normally send into the atmosphere more co2 than can be removed by other natural processes. (It's a balance.) 2) co2 produced by human activity is indistinguishable from co2 produced naturally. With greater co2 concentrations, there is an increase in the sinks (more co2 is removed) because there is a greater concentration of co2. The wording suggests, to the uncritical reader, that there is no natural sink to take up (at least some, if not the majority of) the extra carbon. blackcloak (talk) 18:07, 8 September 2008 (UTC)
--very true. anyone with even a high school knowledge of chemistry and chemical reactions should be able to tell you what happens when you have an equilibrium like that one and some factor changes. —Preceding unsigned comment added by 207.237.50.106 (talk) 05:18, 29 October 2008 (UTC)
-- Blackcloak has a point, about whether of not the sources and sinks are in balance. But there can be no doubt that human activity with respect to geologically captured products of photosynthesis has increased the output of the sources, while on the other side, the destruction of forests and other greenery has certainly diminished the activity of the sinks. DaveyHume (talk) 13:35, 16 July 2014 (UTC)
Article Topic?
Is this an article about carbon dioxide in earth's atmosphere, or an article about anthropogenic global warming theory? The green house gas role of CO2 is very well described, but there is very little mention of what good CO2 does in our atmosphere, i.e. being essential for life. Please revise the article to cover 10% about global warming and 90% about CO2s role in the biosphere. There are plenty of article on Wikipedia about AGW. —Preceding unsigned comment added by 98.207.143.91 (talk) 04:18, 2 October 2008 (UTC)
- Fair Point. However much of this is covered in Carbon cycle which link i have added to /* See also */ *Carbon cycle. However please feel free to "revise the article to cover 10% about global warming and 90% about CO2s role in the biosphere." and get a wikipedia account while you are at it.--Theo Pardilla (talk) 11:26, 2 October 2008 (UTC)
Anthropogenic CO2
I've heard from many global warming naysayers that the human race's contribution to the amount of CO2 put into the atmosphere from all sources is very small. I have not been able to find any data on this. Could someone clear this up for me? Just how much CO2 do we actually contribute? Phasmatisnox (talk) 01:07, 27 December 2008 (UTC)
- The human-caused flux of CO2 into the atmosphere is about 6.5 gigatons per year. This is fairly small relative to the total of natural sources and sinks, which if memory serves is something over 100 gigatons per year. The more important point is that natural sources and sinks are in balance as reflected in the fact that CO2 concentrations were remarkably steady for the 10,000 years or so preceding the Industrial Revolution (less than +/- 5% variation). The CO2 increase has occurred because the human-caused source is not balanced by a corresponding sink. Short Brigade Harvester Boris (talk) 01:46, 27 December 2008 (UTC)re
- I am confused by your use of the word 'flux'. In a given year, how much of the CO2 going into the atmosphere is manmade in origin? Phasmatisnox (talk) 04:34, 28 December 2008 (UTC)
- That's the 6.5 gigatons, or roughly 5% of the total input. Short Brigade Harvester Boris (talk) 04:52, 28 December 2008 (UTC)
- Old discussion I realize, but some of these have been updated and the question may be misleading. Humans now put in about 10 gigatons of CO2 per year into the atmosphere (http://cdiac.ornl.gov/GCP/). I think Short Brigade Harvester Boris forgot oceans, so the total gross flux is closer to around 200 gigatons of CO2 per year, which still puts humans gross flux at ~5%. This gross can be misleading though, as natural (oceans and land) currently take up ~195 gigatons per year (i.e. more than they emit). So in the net, 5 gigatons stay in the air, or 100% (or close to it) of the net CO2 going into the atmosphere is from humans. A helpful figure is from the IPCC 2008, do an image search for "IPCC carbon cycle 2008" (in section 2.5 here: http://www2.geog.ucl.ac.uk/~plewis/geogg124/carbonCycle.html). You can add/subtract the arrows yourself to see contributions. Jacobkhed (talk) 19:15, 9 February 2016 (UTC)
- That's the 6.5 gigatons, or roughly 5% of the total input. Short Brigade Harvester Boris (talk) 04:52, 28 December 2008 (UTC)
- I am confused by your use of the word 'flux'. In a given year, how much of the CO2 going into the atmosphere is manmade in origin? Phasmatisnox (talk) 04:34, 28 December 2008 (UTC)
- It's just as important to ask what is the magnitude of the human-caused C02 sinks. Agriculture, forestry (wood and paper production), irrigation of marginal lands, use of fertilizers to stimulate growth should tie up more CO2 than the grasslands or forests now converted to agricultural use. blackcloak (talk) 03:49, 12 January 2009 (UTC)
- No, not really. What we grow, we grow for consumption. The carbon dioxide that becomes the wheat in our hamburger buns is released again when we eat that hamburger and breath. Fertilization and irrigation may increase the rate of plant growths, but we are using nearly all of that plant matter in the very short term. And a field of wheat fixes a lot less carbon that a forest of the same size, and probably even less than a grassland. Land use change overall has contributed towards carbon dioxide increase. --Stephan Schulz (talk) 08:27, 12 January 2009 (UTC)
- An (old) forest is in equilibrium with its environment. It takes in as much CO2 as it gives off. Perhaps a significant amount of CO2 leaves the forest through ground water, the CO2 becoming sequestered elsewhere (underground, ocean floor). The only land sink of CO2 I know of is peat, which can lock up carbon for millenia. In a stable environment, even glaciers must be in equilbrium (the case where sea levels don't change). In this case, just as much CO2 is captured in snow/ice as melts from snow/ice, though water runoff may result in C sequestering elsewhere. Good quality wood (as opposed to fire wood) removed from forests and used for most human purposes locks up CO2 for decades, if not centuries. Perhaps you could supply your favorite reference justifying your comment about human land use and the net carbon dioxide increase. blackcloak (talk) 06:21, 17 January 2009 (UTC)
- Yes, you are right with respect to the equilibrium of mature forests. I was talking about the one-off effect of converting a forest to agricultural lands (or vice versa). Even though its only one-off, considering that e.g. much of Europe and the eastern US was covered in forests, the overall effect is significant. Yes, i we convert wood to long-lived products, that CO2 is locked away for the life time of the product. But that is only a very small part of the biomass in a forest, and sustainable timber production is only a very small human endeavor. As for reliable sources, see e.g. this new statement from the Royal Society of New Zealand [2]: "The global increases in carbon dioxide concentration since pre-industrial times are due primarily to fossil fuel use and land use change" and "About 2/3rds of these anthropogenic carbon dioxide emissions since 1750 are estimated to have come from fossil fuel burning and about 1/3 from land use change", or check the IPCC reports. --Stephan Schulz (talk) 08:37, 17 January 2009 (UTC)
- An (old) forest is in equilibrium with its environment. It takes in as much CO2 as it gives off. Perhaps a significant amount of CO2 leaves the forest through ground water, the CO2 becoming sequestered elsewhere (underground, ocean floor). The only land sink of CO2 I know of is peat, which can lock up carbon for millenia. In a stable environment, even glaciers must be in equilbrium (the case where sea levels don't change). In this case, just as much CO2 is captured in snow/ice as melts from snow/ice, though water runoff may result in C sequestering elsewhere. Good quality wood (as opposed to fire wood) removed from forests and used for most human purposes locks up CO2 for decades, if not centuries. Perhaps you could supply your favorite reference justifying your comment about human land use and the net carbon dioxide increase. blackcloak (talk) 06:21, 17 January 2009 (UTC)
- I read much of your referenced article. This a secondary source (summarizes results collected from primary sources). "The global increases in carbon dioxide concentration since pre-industrial times are due primarily to fossil fuel use and land use change." Certainly fossil fuel use increases the amount of CO2 entering the atmosphere, where presumably it will be partially responsible for increasing in a long term time averaged sense the CO2 concentration. As for land use change, that can go either way. The authors seem to be implying that the long term average concentration of CO2 in the atmosphere is partially due to the net effects of human based changes in the use of land. While this may be true, I'd like to see a primary source that attempts to fully quantify changes in the sink component due to human based land use change. Regarding the second occurrence of the term "land use" in the article, quoted here fully: "About 2/3rds of these anthropogenic carbon dioxide emissions since 1750 are estimated to have come from fossil fuel burning and about 1/3 from land use change. About 45% of this carbon dioxide has remained in the atmosphere." I have a problem with the last sentence because it implies that somehow anthropogenic CO2 is not recycled in the same way naturally occuring CO2 is, or that the entire 45% is directly due to anthropogenic actvity. In particular the sentence does not appear to allow for natural feedback processes which drive CO2 into the atmosphere as a consequence of temperature rise (CO2 release from oceans). I'd rather they just say the average long term concentration of CO2 in the atmosphere has risen xx% since 1750. Consider as a thought experiment the following: Suppose man's activities only emitted excess H2O into the atmosphere. The additional H2O would serve as the agent for warming the atmosphere, and the ocean reservoir of CO2 would start to enter/re-enter the atmosphere. I assert that there is an amount of H2O that could be injected into the atmosphere that would result in the present level of CO2. blackcloak (talk) 06:28, 19 January 2009 (UTC)
- See e.g. [3], [4], or any number of other sources. The 45% does not refer to the increase in atmospheric concentration, but relates the amount of anthropogenic CO2 to the amount of extra CO2 in the atmosphere. At the moment, natural sinks still increase with atmospheric concentration (the big, fast-acting sink is the ocean, which will absorb CO2 until the equilibrium between dissolved CO2 in the water and atmospheric CO2 has been reached - the result is Ocean acidification, something we can and do observe), they just cannot keep up. Also see here for how we know were the CO2 is coming from. Your assertion is interesting, but I doubt it. Water vapor is removed from the atmosphere very fast - it does not act as a climate forcing, but rather as a feedback. You would certainly need some magic super-tech to keep water vapor up in a cold atmosphere without massive cloud formation. --Stephan Schulz (talk) 08:21, 19 January 2009 (UTC)
- Thanks for your thoughtful response. I could not load ref 3 (some cookie problem) and ref 4 was IPCC which I consider secondary. Nonetheless is quickly checking a few areas, I found nothing on the carbon sink budget. I still can't figure out unambiguously what the 45% really means. In thought experiments you have to accept the premise, for the purpose of running the experiment. Apparently you consider the premise so absurd that you don't want to waste any time trying to understand what would happen under those conditions. But, as for your observation that water leaves the atmosphere rapidly, let me try to convince you that relatively small water vapor concentration increases may be significant. As I understand it, the average H2O concentration in the atmosphere is 1%. Most of the time this is not enough concentration (depending on temperature of course- and probably pressure) for clouds and/or rain to form. The Greenhouse effect has to be dominated by average greenhouse gas concentrations, i.e. largely when clouds have not formed. Note, the cooling half of the equilibrium cycle depends on the IR radiation leaving the earth (which clouds significantly impede). So what would happen if the H2O concentration simply increased from 1% to 1.01%? That additional 1% (of 1%) would, since H2O is the dominant greenhouse gas, increase thermal energy transfer by 1%, to and from, the thermal energy temporarily stored in the atmosphere. An average 1.01% H2O would not change the "appearance" of the earth's atmosphere- i.e. there would be an imperceptively small increase in cloud formation. But that "little" extra H2O would increase heating and cooling rates by 1%. Nominally the two effects would cancel in the daily temperature cycle. So we have to consider secondary effects. Slightly higher daytime temperatures might mean more wind, and more evaporation, as well as an increase in CO2 release rates from the oceans. The corresponding lower nighttime temperatures might reduce average wind speeds enough to reduce ever so slightly CO2 take up by the oceans, and slow down evaporation. And BTW, that 1% (of 1%) increase in water vapor concentration is roughly the equivalent to the magnitude of the greenhouse effect due to the entire amount of CO2 in the atmosphere. blackcloak (talk) 09:08, 20 January 2009 (UTC)
- The first ref was [1]. Also see [2]. You should be able to find them via Google Scholar, or a library. Or just type "land use change greenhouse" into Google Scholar yourself. --Stephan Schulz (talk) 09:28, 20 January 2009 (UTC)
- Thanks for your thoughtful response. I could not load ref 3 (some cookie problem) and ref 4 was IPCC which I consider secondary. Nonetheless is quickly checking a few areas, I found nothing on the carbon sink budget. I still can't figure out unambiguously what the 45% really means. In thought experiments you have to accept the premise, for the purpose of running the experiment. Apparently you consider the premise so absurd that you don't want to waste any time trying to understand what would happen under those conditions. But, as for your observation that water leaves the atmosphere rapidly, let me try to convince you that relatively small water vapor concentration increases may be significant. As I understand it, the average H2O concentration in the atmosphere is 1%. Most of the time this is not enough concentration (depending on temperature of course- and probably pressure) for clouds and/or rain to form. The Greenhouse effect has to be dominated by average greenhouse gas concentrations, i.e. largely when clouds have not formed. Note, the cooling half of the equilibrium cycle depends on the IR radiation leaving the earth (which clouds significantly impede). So what would happen if the H2O concentration simply increased from 1% to 1.01%? That additional 1% (of 1%) would, since H2O is the dominant greenhouse gas, increase thermal energy transfer by 1%, to and from, the thermal energy temporarily stored in the atmosphere. An average 1.01% H2O would not change the "appearance" of the earth's atmosphere- i.e. there would be an imperceptively small increase in cloud formation. But that "little" extra H2O would increase heating and cooling rates by 1%. Nominally the two effects would cancel in the daily temperature cycle. So we have to consider secondary effects. Slightly higher daytime temperatures might mean more wind, and more evaporation, as well as an increase in CO2 release rates from the oceans. The corresponding lower nighttime temperatures might reduce average wind speeds enough to reduce ever so slightly CO2 take up by the oceans, and slow down evaporation. And BTW, that 1% (of 1%) increase in water vapor concentration is roughly the equivalent to the magnitude of the greenhouse effect due to the entire amount of CO2 in the atmosphere. blackcloak (talk) 09:08, 20 January 2009 (UTC)
- See e.g. [3], [4], or any number of other sources. The 45% does not refer to the increase in atmospheric concentration, but relates the amount of anthropogenic CO2 to the amount of extra CO2 in the atmosphere. At the moment, natural sinks still increase with atmospheric concentration (the big, fast-acting sink is the ocean, which will absorb CO2 until the equilibrium between dissolved CO2 in the water and atmospheric CO2 has been reached - the result is Ocean acidification, something we can and do observe), they just cannot keep up. Also see here for how we know were the CO2 is coming from. Your assertion is interesting, but I doubt it. Water vapor is removed from the atmosphere very fast - it does not act as a climate forcing, but rather as a feedback. You would certainly need some magic super-tech to keep water vapor up in a cold atmosphere without massive cloud formation. --Stephan Schulz (talk) 08:21, 19 January 2009 (UTC)
- I read much of your referenced article. This a secondary source (summarizes results collected from primary sources). "The global increases in carbon dioxide concentration since pre-industrial times are due primarily to fossil fuel use and land use change." Certainly fossil fuel use increases the amount of CO2 entering the atmosphere, where presumably it will be partially responsible for increasing in a long term time averaged sense the CO2 concentration. As for land use change, that can go either way. The authors seem to be implying that the long term average concentration of CO2 in the atmosphere is partially due to the net effects of human based changes in the use of land. While this may be true, I'd like to see a primary source that attempts to fully quantify changes in the sink component due to human based land use change. Regarding the second occurrence of the term "land use" in the article, quoted here fully: "About 2/3rds of these anthropogenic carbon dioxide emissions since 1750 are estimated to have come from fossil fuel burning and about 1/3 from land use change. About 45% of this carbon dioxide has remained in the atmosphere." I have a problem with the last sentence because it implies that somehow anthropogenic CO2 is not recycled in the same way naturally occuring CO2 is, or that the entire 45% is directly due to anthropogenic actvity. In particular the sentence does not appear to allow for natural feedback processes which drive CO2 into the atmosphere as a consequence of temperature rise (CO2 release from oceans). I'd rather they just say the average long term concentration of CO2 in the atmosphere has risen xx% since 1750. Consider as a thought experiment the following: Suppose man's activities only emitted excess H2O into the atmosphere. The additional H2O would serve as the agent for warming the atmosphere, and the ocean reservoir of CO2 would start to enter/re-enter the atmosphere. I assert that there is an amount of H2O that could be injected into the atmosphere that would result in the present level of CO2. blackcloak (talk) 06:28, 19 January 2009 (UTC)
- ^ Houghton, R.A. (298 - 313). "The annual net flux of carbon to the atmosphere from changes in land use 1850–1990". Tellus B. 51 (2): 298–313.
{{cite journal}}: Check date values in:|date=(help) - ^ "Soil carbon sequestration and land-use change: processes and potential". Global Change Biology. 6 (3): 317–327. 2008.
{{cite journal}}: Unknown parameter|coauthors=ignored (|author=suggested) (help)
- The first ref is about, based on a reading of the abstract, which is all I can get to, the unintended consequences of using current cropland for biofuels. It does not discuss the topic of sinks directly, so does not address my question. The second reference is getting very close, for my purposes. In rereading my comments, it occurs to me that I need to know more about absorption cross-sections for H2O and CO2, and relaxation times. Presumably these are wavelength dependent and pressure/temperature dependent. Do you have any good sources for these topics? blackcloak (talk) 19:08, 20 January 2009 (UTC)
- This figure provides information on the full atmosphere absorption, which is principally a convolution of the concentrations with the wavelength-dependent absorption cross-sections. Temperature and pressure variation have relatively little impact on absorption over the range of the atmosphere where there is enough mass to be important. One can usually make the further approximation that the spontaneous relaxation time is much longer than the intermolecular collision time, so any energy that is absorbed is effectively coupled as heat to the rest of the local atmosphere. The file's description links to an online calculator if you want more detail though it would take some effort to extract the full details from that.
- The point in asking about absorption cross sections (and related physical characteristics like relaxation times and paths) is to understand why H2O absorption (and re-emission) doesn't so dominate CO2 absorption as to relegate CO2 concentrations to having no more than a 3% effect on overall (thermal) energy transfer rates. I'm looking for data/information that I have not found anywhere on Wikipedia. blackcloak (talk) 07:25, 21 January 2009 (UTC)
- Relative to the larger conversation, it is important to note that the atmospheric abundance of water vapor only represents about two weeks of rainfall. As a result, perturbations to the water system will literally rain out over short time scales. Hence, a water vapor excess can't accumulate over years they way a CO2 excess can, but rather would have to be driven by a fast acting, persistent process. One can legitimately wonder whether any environmental perturbations (for example in land use) have that effect, but most direct emission processes are simply too slow to get to even 1% in the limited time available. Dragons flight (talk) 20:11, 20 January 2009 (UTC)
- I'm using very long term averages for H2O concentrations, so things that happen on the two week time scale are irrelevant. A 1% increase in evaporation rates means that the long term average H2O concentrations must increase by 1%. That's the way linear systems work. You could probably write a EXCEL spreadsheet simulation that would convince yourself that this indeed would be the case. blackcloak (talk) 07:25, 21 January 2009 (UTC)
- Old discussion, but I'd like to just make one correction here: If water evaporation is increased by 1%, that does not mean the atmospheric concentration of water vapor will increase by 1%. Rather, it means that the amount of precipitation will increase by 1%, since the atmosphere is in equilibrium; any extra water you add to it will be eliminated in the form of precipitation. Think of the atmosphere as a clogged sink, and the water evaporation as the water pouring into it. After reaching equilibrium, the water will be at the edge of the sink, overflowing it. That overflow is equivalent to precipitation. If you nudge the faucet up just a bit, enough to increase the water influx by 1%, that doesn't mean the water will reach 1% above the edge of the sink, it just means 1% more water will flow over the edge. Sakkura (talk) 15:34, 19 December 2009 (UTC)
Can the origins section be made more quantitative?
The origins section lists sources of CO2 but doesn't give any sort of breakdown as to which sources are large and which are small and what the relative amounts of them are. I recall seeing a breakdown of these sources by percentage at one point, but I can't remember where I read it and a brief Google is not helpful. Can we add some more info here about what the relative amounts of emissions from each of these sources are? If someone can point me at a source, that would help. Oren0 (talk) 20:23, 4 April 2009 (UTC)
"Without these sources..."
The current article says: "Currently about 57% of human-emitted CO2 is removed by the biosphere and oceans; without this effect CO2 levels would be even higher." I thought removing the end of this statement would be pretty uncontroversial but apparently not. Isn't this statement redundant? This is like saying "The Earth's temperature is rising. Without this rise, the temperature would be cooler."? Oren0 (talk) 20:35, 4 April 2009 (UTC)
- People often ask, what proportion of CO2 rise is human caused, and seem surprised when I say "more than 100%", so I don't think it is well known or well understood; some degree of repetition may be desirable William M. Connolley (talk) 21:53, 4 April 2009 (UTC)
- It'd be one thing if the statement was "without human emissions, the net effect of the biosphere and oceans would cause CO2 to decrease," assuming that's true and can be cited. But all this sentence says is that if CO2 wasn't removed from the atmosphere, there'd be more CO2. It seems to me that this goes without saying. Oren0 (talk) 21:56, 4 April 2009 (UTC)
- You fail to miss the point. The natural sinks, at least for the moment, increase with CO2 concentration in the atmosphere. The primary mechanism is that CO2 solution into the ocean water increases with the concentration of CO2 in the atmosphere. --Stephan Schulz (talk) 22:20, 4 April 2009 (UTC)
- It'd be one thing if the statement was "without human emissions, the net effect of the biosphere and oceans would cause CO2 to decrease," assuming that's true and can be cited. But all this sentence says is that if CO2 wasn't removed from the atmosphere, there'd be more CO2. It seems to me that this goes without saying. Oren0 (talk) 21:56, 4 April 2009 (UTC)
Halflife of CO2
I was wondering why this article doesn't mention the half-life of CO2 in the atmosphere, in the same way that the half-life of methane is mentioned in the lead of that article? I found this which says
| “ | The result is that a simple “half-life” model doesn’t work for carbon dioxide – the physical system has too many variable and components to claim that CO2 has an single atmospheric lifetime... The half-life of radioactive waste cannot be simply and easily defined, and neither can the half-life (lifetime) of CO2 in the atmosphere. | ” |
That sounds reasonable, the author brings up a point about the IPCC changing the definition as well, so obviously there is some debate about how best to explain the half-life concept in the context of atmospheric CO2. Could someone knowledgeable about this please add an explanation to this article? 78.105.234.140 (talk) 16:11, 22 October 2009 (UTC)
There is a half-life of CO2 in the atmosphere in the sense that CO2 molecules move between the atmosphere, the land (vegetation and detritus mostly) and the upper ocean (carbonic acid) with a half-life of on the order of a decade or two. However that half-life is often misinterpreted to mean that if we stopped pumping more anthropogenic CO2 into the atmosphere, that it would settle back to pre-industrial levels on that time scale. In fact, it would take much, much longer, on the order of a century or a few centuries (the calculations are rather uncertain), to go down by half, since that total reservoir of atmosphere/land/upper-ocean is in equilibrium compared to the time scale of exchange with the deep ocean and other responses to the increased CO2. So the CO2 that is absorbed by the land and upper ocean is re-emited by them at the same rate. Therefore the decade-ish half-life of atmosphere CO2 is not relevant when considering how to deal with the excess CO2 we are pumping into that total, three-part reservoir.
The time scale for the removal of CO2 from that total reservoir is not exponential -- the amount of time to get halfway back to 280 ppmv (taking that to be the "equilibrium" value) is not the same as the time to get another quarter of the way (half of the remaining way) back to 280 ppmv, so it cannot be described as a half-life. To make it even more confusing, I have seen the term "single half-life" used to describe the time to get 50% of the way to the equilibrium value, acknowledging that the time for that "single" or first half-life is not the same as the time for the second half-life. Since it isn't, the term "half-life" shouldn't be used in the first place. Mark Adler 21:46, 22 May 2010 (UTC)
Requested move
- The following discussion is an archived discussion of a requested move. Please do not modify it. Subsequent comments should be made in a new section on the talk page. No further edits should be made to this section.
The result of the move request was page moved. Skomorokh, barbarian 19:18, 8 November 2009 (UTC)
Carbon dioxide in the Earth's atmosphere → Carbon dioxide in Earth's atmosphere — - [I find it awkward and superfluous to have "the" in the article name.] --Shirifan (talk) 01:15, 31 October 2009 (UTC)
- Atmospheric carbon dioxide would be even more concise. (It's already a redirect to this page.) —Preceding unsigned comment added by Snottywong (talk • contribs) 13:34, 31 October 2009 (UTC)
- Problem is "atmospheric" doesn't make it specific to Earth. For example there is a lot to be said about carbon dioxide in Venus' atmosphere. Another point is that the "parent" article is called Earth's atmosphere. --Shirifan (talk) 02:21, 1 November 2009 (UTC)
- The above discussion is preserved as an archive of a requested move. Please do not modify it. Subsequent comments should be made in a new section on this talk page. No further edits should be made to this section.
Content
Too many different units, try settling on megatonnes. The teratonnes, gigatonnes, short tons, etc are too confusing, even for my EE brain. —Preceding unsigned comment added by 137.100.46.254 (talk) 15:43, 8 December 2009 (UTC)
Partial Pressure
How can this article not have the partial pressure of CO2 in the atmosphere listed? It's the most relevant measure of CO2 content, much more so than gigatonnes or megatonnes etc. I'd assume it's somewhere in the region of 300-500 Pa, but obviously adding this to the article requires a better source than, say, multiplying the fraction of CO2 with the total atmospheric pressure (even though such a calculation might make sense, it's OR). Sakkura (talk) 15:47, 19 December 2009 (UTC)
Also, the statement at the very start of the article, "Carbon dioxide (CO2) forms approximately 0.04% of the nominal 5,000,000 gigatonnes of gas and aerosols that comprise the Earth's atmosphere." is wrong. The 0.04% refers to the volume fraction (currently about 0.039%), not the mass fraction. The mass fraction is about 44/29 of the volume fraction, where the molecular mass of the CO2 is 44 g/mol, and the average dry molecular mass of the atmosphere is 29 g/mol. So the mass fraction is more like 0.06%. So that first statement is not only original research, but incorrect original research. It should instead it should say something like "Earth's atmosphere (dry) contained 3xx ppmv (parts per million volume) Carbon Dioxide (CO2) in 2010, rising at approximately yy ppmv per decade." with the right numbers and a reference. If you want to put the total mass of the CO2 in the atmosphere in there, then find a source and put it in. However it would also need to say when that number was the estimated mass, since it's increasing at a pretty good clip. Mark Adler 21:48, 22 May 2010 (UTC)
Article probation
Please note that, by a decision of the Wikipedia community, this article and others relating to climate change (broadly construed) has been placed under article probation. Editors making disruptive edits may be blocked temporarily from editing the encyclopedia, or subject to other administrative remedies, according to standards that may be higher than elsewhere on Wikipedia. Please see Wikipedia:General sanctions/Climate change probation for full information and to review the decision. -- ChrisO (talk) 13:38, 2 January 2010 (UTC)
copyedits
I restructured some paragraphs in the origins and sources sevtions, and combined those two sections. The section still needs some copyedits--Work permit (talk) 10:33, 23 January 2010 (UTC)
methane-carbon dioxide-water clathrates
An unknown, though probably large, quantity of CO2 is in the ocean sediments as a methane-carbon dioxide-water clathrates, one of the family of gas hydrates.
I removed the above uncited claim from Carbon dioxide in Earth's atmosphere#Relationship with oceanic concentration because a Google Scholar search did not help verify "unknown", "probably large", nor indeed any evidence of existence in the sediments. Please re-insert the claim, possibly reworded, with a precise cite. Here's a list of possible, but ultimately insufficent, sources:
- [5] Energy Fuels, 1998, 12 (1), pp 183–188. DOI: 10.1021/ef970172q . January 12, 1998. American Chemical Society. "liquid CO2 the released globules appeared to form a hydrate skin ... we observed an apparent complete dissolution of the liquid CO2 mass"
- [6] J. Phys. Chem. B, 2003, 107 (15), pp 3507–3514. DOI: 10.1021/jp0263370 . March 20, 2003. American Chemical Society. "experimental structure-I clathrate hydrate (methane, carbon dioxide, and methane−carbon dioxide)"
- [7] Fixation of carbon dioxide by clathrate-hydrate. Saji, A | Yoshida, H | Sakai, M | Tanii, T | Kamata, T | Kitamura, H. Energy Conversion & Management [ENERGY CONVERS. MANAGE.]. Vol. 33, no. 5-8, pp. 643-649. 1992.
- [8] Transformation of Methane Hydrate to Carbon Dioxide Hydrate: In Situ Raman Spectroscopic Observations Ji-Ho Yoon, Taro Kawamura, Yoshitaka Yamamoto, and Takeshi Komai. J. Phys. Chem. A, 2004, 108 (23), pp 5057–5059. DOI: 10.1021/jp049683l . April 30, 2004. "phenomena of the coexistence of methane and carbon dioxide hydrates"
- [9] Microscopic observations of formation processes of clathrate-hydrate "lms at an interface between water and carbon dioxide. Tsutomu Uchida*, Takao Ebinuma, Jun'ichi Kawabata, Hideo Narita. Journal of Crystal Growth 204 (1999) 348-356.
-84user (talk) 11:47, 7 February 2010 (UTC) added more sources -84user (talk) 19:58, 7 February 2010 (UTC)
- After looking at sources [10] and [11] provided to me, the following is the best that I can source so far.
- [12] Venting of Carbon Dioxide-Rich Fluid and Hydrate Formation in Mid-Okinawa Trough Backarc Basin. H. Sakai et al. Science 1 June 1990. Vol. 248. no. 4959, pages 1093-1096. DOI:10.1126/science.248.4959.1093 . "Carbon dioxide-rich fluid bubbles, containing approximately 86 percent CO2, 3 percent H2S, and 11 percent residual gas (CH4 + H2), were observed to emerge from the sea floor at 1335- to 1550-m depth in the JADE hydrothermal field, mid-Okinawa Trough. Upon contact with seawater at 3.8°C, gas hydrate immediately formed on the surface of the bubbles and these hydrates coalesced to form pipes standing on the sediments." (cannot obtain full paper to determine what is meant by "gas", abstract does not give the composition of the clathrate)
- [13] refers to the above paper by H. Sakai and claims "In the sea of Japan geothermally heated fluids containing very high concentrations of carbon dioxide at depths greater than 1500 m [19] have been discovered. These have been observed to precipitate on cooling once the temperature is less than 10°C, thus confirming solid clathrate as the equilibrium state of carbon dioxide in the NaCl-CO2-H2O ternary system." (I am unable to verify this is a valid summary of Sakai's paper)
- Tsutomu Uchida's 1999 paper states that "At pressures higher than 4.45 MPa and temperatures lower than 283.4 K, hydrates form when CO2 reacts with pure water [1]. In seawater, salts shift the formation condition to higher pressures or lower temperatures. In general, CO2 hydrate forms in the oceans below 400 m [4]" Uchida then points out that "However, Aya et al. [5] showed that CO2 hydrates appearing as thin films on the surface of a CO2 droplet somewhat weakened the dissolution rate of CO2 but never thickened nor protected the inner liquid CO2." (an experiment with a water drop in liquid CO2)
- Clathrate hydrates of natural gases. E. Dendy Sloan, Carolyn Ann Koh. Edition 3, illustrated. CRC Press, 2008. ISBN: 0849390788 ISBN-13: 9780849390784. page 1: "Natural gas hydrates are crystalline solids composed of water and gas. ... Typical natural gas molecules include methane, ethane, propane, and carbon dioxide."
Absorption Spectrum?
Could the absorption spectrum of carbon dioxide be added to this page? I am basically thinking of something like the graph on http://www.te-software.co.nz/blog/augie_auer.htm If someone can point me to that data in machine readable format, I would be happy to create a graph, but I have not found it yet. Thank you. Jrincayc (talk) 15:28, 20 June 2010 (UTC)
- One possible old source: Howard, J. N., D. E. Burch, and D. Williams, 1955 : Near-infrared transmission through synthetic atmospheres. Geophys. Research Papers, No. 40, AFCRC-TR-55-213. (Available from Library of Congress Photoduplication Service Publication Board Project, Washington 25, D. C; OTS No. PB 121048. Price: microfilm $11.10; photocopy $39.60. Jrincayc (talk) 22:34, 20 June 2010 (UTC)
Global
I don't understand this [14]. This article is about the global CO2 (first) not the ML CO2, so we shouldn't be talking about the ML specifically in the first sentence. But the global avg is ~390, so all is well without that edit. There is already a section on "Current concentration" which says that the value isn't totally uniform William M. Connolley (talk) 06:48, 10 October 2010 (UTC)
- That was a drive-by WP:BRD edit. I was about to revert the earlier change to 290 but, in rechecking the cited source, I noticed the caveats there which I thought it might be useful to make more visible in assertions supported by that source. I'm no expert here, and won't argue the point. Wtmitchell (talk) (earlier Boracay Bill) 23:49, 10 October 2010 (UTC)
Misleading charts and graphs
All four of the charts/graphs in this article are misleading, using a rather pedestrian set of graphic tricks. It seems to me that this should be of particular concern to the proponents of anthropogenic global warming (AGW), because common sense suggests that if the scientific case is solid, there should be no lead to use misleading statistics or graphs.
Indeed, two of the charts -- the first and third -- expressly violate the principal rule stated in the Wikipedia article on the subject, titled "Don't Draw Misleading Graphs." This article explains: "The most commonly seen 'sensationalization' of graphs in the popular media is probably when the graph is drawn with the vertical axis starting not at 0, but somewhere just below the low point in the data being graphed. Both upward and downward trends are exaggerated, for a more exciting look." —Preceding unsigned comment added by 010114692a (talk • contribs) 00:45, 28 October 2010 (UTC)
The first chart is the "Keeling Curve," which shows the increase of atmospheric CO2 levels from 315 ppm in 1959 to 385 ppm in 2008. Note that the horizontal (x) axis of the graph crosses the vertical (y) axis at 310 ppm, and that the range shown on the vertical axis runs from 310 to 390 ppm, the effect of which is to greatly exaggerate the apparent increase. Optically, the graph suggests that CO2 levels have increased by a factor of about 14 (i.e. 1400%), while the real increase is 22%. The chart is technically true, but gives a false impression by restricting the range displayed.
The second chart is "Global fossil carbon emissions," which shows an increase in CO2 emissions from burning of fossil fuel, from near zero in 1800 and 1850 to a little under 9 billion metric tons per year in 2007 -- the text indicates that the true figure for 2008 was 8.67 billion metric tons (of carbon). This is misleading because these emissions are dwarfed by natural CO2 emissions, which the article states are about 220 billion metric tons per year (of CO2) -- which is 60 billion metric tons of carbon -- from the decay of organic material alone. I understand that the proponents of AGW contend that the global carbon cycle had been in equilibrium before recent human activity, and that the increases in overall CO2 levels should be attributed entirely (or almost entirely) to human activity. But this chart seems to mislead by omission. The fact is that fossil fuels make a relatively small contribution to overall carbon emissions -- indeed, the fossil fuel contribution is only about 16% of the contribution of decaying vegetation.
The use of units in the section accompanying the second chart is also confusing, as the chart and parts of the text use tons of carbon as the measurements, while other parts of the text use tons of carbon dioxide. This is noted, though not explained, in a part of the text that -- properly -- equates 8.67 gigatonnes of carbon with 31.8 gigatonnes of CO2. I understand that some sources report the mass of CO2, while others report the mass of carbon alone (about 27.3% of the mass of the CO2 molecule). It would be helpful if the text and charts were consistent in the units used, or at least uniformly reported both units of measurement.
The third chart is "Carbon Dioxide Variations," which shows shows CO2 levels varying in approximately the 200-300 ppm range for the past 400,000 years, then increasing to about 380 ppm in the past 200-250 years. Like the "Keeling Curve" noted above, this chart also misleads by manipulation of the horizontal axis -- indeed, it manages to mislead twice in a single chart. In the main chart, horizontal axis of the graph crosses the vertical axis at about 175 ppm, and that the range shown on the vertical axis runs from 175 to 400 ppm, the effect of which is to greatly exaggerate the apparent increase. In the insert titled "The Industrial Revolution Has Caused A Dramatic Rise In CO2," the misleading effect is exaggerated further, as the horizontal axis crosses the vertical axis at about 250 ppm, and the range shown on the vertical axis runs from 250 to 400 ppm.
The fourth chart is "Phanerozoic Carbon Dioxide," which shows CO2 levels for the past 500 million years. CO2 levels were generally much higher in the distant past -- 10-20 times higher about 400-500 million years ago (4000-6000 ppm compared to current 385 ppm), and 3-4 times higher about 100-200 million years ago (1000-2000 ppm). This chart is misleading because the more recent period is on the left side of the chart, the opposite of the usual right-to-left convention. The explanation at the bottom of the chart points out this counterintuitive orientation and explains that "much of the last 550 million years has experienced carbon dioxide concentrations significantly higher than the present day." But the confusion could be completely eliminated by simply reversing the horizontal axis on the chart.
In summary, the creators of all four charts in this article made choices regarding the ranges presented, the information included or excluded, or the orientation of the chart, which are somewhat misleading or confusing. What arouses my suspicion is that while the misleading or confusing aspect of the four charts differ, the effect is uniformly in the direction of exaggerating the effect of human activity on CO2 levels.
Can't someone simply make some better charts? Or just refer me to the data and let me know where to send the updated charts -- it would probably take less than an hour to fix all of these issues.
010114692a (talk) 00:30, 28 October 2010 (UTC)
These criticisms of the graphs have been raised before above and they seem to be one of the staples of the contrarians, thereby revealing their absolute lack of scientific background. One rarely or ever starts a graph at 0 if none of the data are at or near 0, either in scientific literature or even school textbooks. Just as you wouldn't start a graph showing the growth of a person from the age of 10 to 18 at 0cm because no 10-year old is 0cm tall, so there is no sense in starting the CO2 graph at 0 as CO2 was not at 0 in the 1950s nor in fact in the whole geological history of the Earth. Even a schoolchild who drew a graph with a Y axis starting at 0 and the data points bunched up at the top with none close to zero would be marked down by his teacher.
I would challenge anyone who makes this point to find a graph in a reputable scientific publication that fits their view of how a graph should be drawn —Preceding unsigned comment added by 78.149.9.132 (talk) 20:49, 27 December 2010 (UTC)
Who are you Al Gore? Go take your fancy misleading charts elsewhere. —Preceding unsigned comment added by 154.5.182.34 (talk) 06:11, 3 February 2011 (UTC)
Well done 78.149.9.132, and 154.5.182.34 well done as well for your perfectly cliche response.174.252.69.148 (talk) 21:50, 9 June 2011 (UTC)
- The graphs are certainly misleading and against Wikipedia policy. However as I'm part of the boycott against wikipedia on climate articles I'm not touching them. — Preceding unsigned comment added by 79.78.82.135 (talk) 09:51, 8 November 2011 (UTC)
Jan 1 2010 edits
3 things: The number "41.7±0.5" seems to be a typo and/or a 'years' reference is missing.
The other is that even though the reference (and number) is correct in the sentence "In 2009, the rise-rate was 1.6 ppm/yr.", it is at odds with reference 1 in the previous sentence(i.e. for 2009 the number is 1.86) and if you are going to use a reference, 1 (a NOAA ref) probably has the most integrity. Also I verified the 2.0 number using refernce 1.
Lastly here is a more recent(than 2001)/additional reference for the last sentence (using ref 5): http://www.sciencedaily.com/releases/2009/10/091008152242.htm
p.s. really was informed by the Irreversibility and Uniqueness of Carbon Dioxide section Awikipedian42 (talk) 01:45, 5 January 2011 (UTC)
The lead section badly needs a rewrite
Wikipedia:Manual of Style (lead section) says, in part
The lead should be able to stand alone as a concise overview of the article. It should define the topic, establish context, explain why the subject is interesting or notable, and summarize the most important points—including any notable controversies.
The lead section of this article does not currently fit this characterization very well. I'm sure that other editors more involved with this article than I are both better wordsmiths than I and better qualified topic-wise than I, so I'll just make the suggestion rather than attempting a ham-handed rewrite myself. Wtmitchell (talk) (earlier Boracay Bill) 23:03, 5 January 2011 (UTC)
rise of growth rate
Over the last months, I have included information about the rise of the growth rate. Namely the doubling of the growth rate from 41.6±0.5 years ago. Please note the following caveats. Interpreting the data as an exponential, as used in the article, gives 259ppm as the historical baseline, which is 20 ppm lower than historical. When using 280ppm, the main difference is that the doubling time decreases to 31.7+-0.067. The significant difference indicates that the data is not purely exponential with a 280 ppm historical baseline, which nevertheless has been established pretty well using other data. Note that the doubling time becomes much more accurate when this data is included, and has been done in [15](probably wrong reference). The doubling time in the article is thus more conservative than in this reference.
The other possible issue going forward is that this approach will show very late if the growth rate is curbed. This however is an even higher order effect. For now we can only conclude that the rise rate has grown.
Note that to less mathematically inclined, this all might appear to much "own research". Indeed, some might prefer only direct quotes. The problem is that NOAA only shows yearly growth rates, which fluctuate too much. That's also why now the growth rate of the last ten years is shown.
Feel free to come up with an alternative which nevertheless points out that the rise-rate is growing. However, consider the following: One possibility I considered is to just mention the growth rate in the 1960's. This has the advantage of increased transparancy, but has the disadvantage of throwing away information, and precluded the possibility of giving error bars. One might still be able to derive a growth rate of the concentration rise. —Preceding unsigned comment added by 82.169.251.18 (talk) 07:44, 24 January 2011 (UTC)
I'm also trying to find better references. Please try to help by looking up "accelerating carbon dioxide growth". They all use the NOAA data as well.
I found this: [16] It's not that authorative (well, it's somebody at NOAA), and the number are a bit different from above, possibly because it is a bit dated. It mentions 31, 35 and 40 year doubling times. To me these are all pretty close anyway. —Preceding unsigned comment added by 82.169.251.18 (talk) 08:07, 24 January 2011 (UTC)
Article needs atmospheric ppmm figures
Hi. The article needs data on the current concentration in ppmm (parts per million by mass). Thanks. ~AH1(TCU) 20:01, 27 January 2011 (UTC)
Uh, why?82.169.251.18 (talk) 03:45, 29 January 2011 (UTC)
Suggestions copied from main
Why is the size of our atmosphere not mentioned? This is easy to calculate, if you think about atmospheric pressure. The units of pressure are mass (or weight) per area, so knowing the atmospheric pressure and the area of the earth at sea level we know the weight of our atmosphere. To say "we emit 7 gigatons per year by burning fossil fuels" and then not follow through to say "the effect on CO2 concentration is this because the whole atmosphere is only this big" seems like a glaring omission to me. Why the obfuscation? This is not THAT difficult to understand. We are burning through our fossil fuels at a breakneck rate that is overloading the atmosphere with amounts of CO2 that are dangerous because CO2 "controls" the greenhouse effect. (see 2010 Best Pub at GISS)
If we look at it in terms of amounts of CO2 emitted per amount of atmosphere per person on earth it may be easier to understand. Doing the pressure times area calculation (per person), I get about 20 acres (8 hectares) of area per person, times atmospheric pressure gives about a million tons of air per person (metric or not, close enough). This is a nice round number that is easy to remember, about a million tons of air per person. Can we show that as a graphic for emphasis? The first Wikipedia graphic does clearly show about 1 ton per person per year being emitted due to extracting and burning fossil fuels (7 billion people, 7 gigatons/yr, 1 ton of CO2 as Carbon per year per person).
The final step to relate these emissions to changes in CO2 concentration requires using our Molecular Weights (MW). See the Periodic Table. Air has an average MW of 29. Since we know Nitrogen N2 (triple bonded) is 28 and O2 (double bonded) is 32, we use the percentages in the air to find the weighted average MW of 29. (This begs the question of how come heavier gases like O2 [or CO2 at MW = 44] don't settle out or stratify. Follow up for more curiosity based learning?) In any case one ton of CO2 as C is 3.7 tons of CO2 as CO2 (44/12) and adding this amount to one million tons of air should increase the CO2 concentration by 2.4 ppm (3.7 x 44/29). This can be looked at like adding pennies to a jar or mixing liquids together. The sources and sinks can be left to the side at first to simplify so readers can understand.
Then when we look at the Keeling curve we see that there must be a major sink. Further investigation leads us to conclude that the oceans have been absorbing about half our emissions, which is verified by the increase in acidity caused by Carbonic acid. Then when we consider the size of the oceans and the much larger heat capacity when compared to the atmosphere we begin to see... our collective situation as being analogous to the frogs put on to boil? Yikes! Again, do we have time to obfuscate? — Preceding unsigned comment added by 66.82.9.54 (talk • contribs) Moved from main article my me. --Stephan Schulz (talk) 13:32, 16 June 2011 (UTC)
Solubility of CO2 in water
I have inserted a sentence simply stating that CO2 is water-soluble, a well known fact which doesn't need another citation since it is well described in the carbonic acid article. It is another well known sink of the atmospheric gas, and has been known for at least a century. Peterlewis (talk) 15:24, 6 August 2011 (UTC)
- You have repeatedly inserted what is at best misleading. Yes, CO2 is soluble in water. That's why the oceans are currently big CO2 sinks (and thereby turn acidic). But dissolution is something happening to solid materials, not to gases, so your statement as written is simply wrong. And we mention the oceans as a sink in the very next sentence. --Stephan Schulz (talk) 23:22, 6 August 2011 (UTC)
- So you do not deny that the gas is water soluble: the oceans, by the way, are becoming less alkaline, which is not the same as becoming acidic if you want to split hairs. Peterlewis (talk) 04:35, 7 August 2011 (UTC)
And just to correct the mistaken edits, dissolution is a generic term for one substance dissolving in another. That of course includes gases dissolving in liquids.Peterlewis. I think you are the one who is misleading our readers, at best. (talk) 17:27, 7 August 2011 (UTC)
Rate of increase
(moved from the top William M. Connolley (talk) 18:25, 20 May 2012 (UTC))
I do not want to make any trouble, but this Wikipedia page starts out with a graph over 50 years showing CO2 change from 315 ppm to 385 ppm. Then the text says the the growth rate is 2.2 % / year exponential.
I do not know if it is going to be linear or exponential. If it is exponential, it is 0.4%, not 2.2%. If it is linear, it is 1.2 ppm / year.Clarkmag (talk) 18:09, 20 May 2012 (UTC) Clarkmag
- Thanks for spotting that. It was inserted by an anon [17] and is, as you say, wrong. I'll remove it. I'm not sure if we want the "true" values added William M. Connolley (talk) 18:25, 20 May 2012 (UTC)
Carbon dioxide levels reach milestone at Arctic sites...400ppm.
I'm entirely new at editing so maybe someone else can add this...http://researchmatters.noaa.gov/news/Pages/arcticCO2.aspx — Preceding unsigned comment added by 108.6.46.67 (talk) 23:52, 9 July 2012 (UTC)
"is critical to life on Earth"
I see no good reason to have this here. Either people know what photosynthesis is, or this off-hand comment is not going to help them. CO2 is a necessary byproduct or feedstock for many biological processed, but in that sense it's not different from many other substances. --Stephan Schulz (talk) 21:32, 4 August 2012 (UTC)
Anthropogenic CO2 increase
While CO2 absorption and release is always happening as a result of natural processes, the recent drastic rise in CO2 levels in the atmosphere is known to be entirely due to human activity.(e.g. Gosh, Prosenjit; Brand, Willi A. (2003). "Stable isotope ratio mass spectrometry in global climate change research") On which of the 33 pages of this paper is said, that ″the recent drastic rise in CO2 levels in the atmosphere is known to be entirely due to human activity″?
--Handwerker (talk) 21:26, 4 March 2013 (UTC)
- Indeed. Tagged with {{qn}} now. GregorB (talk) 21:19, 12 May 2013 (UTC)
- If human activity was the sole cause, would it not have been mentioned in the abstract or the conclusion? Both locations talk a bit about the variations, factors effecting both the values and their measurement, and human contributions, but I don't see a single spot that says that human activity is the one and only cause. — Preceding unsigned comment added by 12.45.169.2 (talk) 14:26, 13 May 2013 (UTC)
- Page 2. "In contrast, current annual fossil fuel burning amounts to about 6 Gt of carbon. About half of this amount is observed as an increase of the atmospheric CO2 concentration. The other half is sequestered by other compartments. Currently, both the oceans and the terrestrial system show a net uptake of carbon." --Stephan Schulz (talk) 16:20, 13 May 2013 (UTC)
- I am certainly not an expert here but...
- the quote provided by Mr. Schulz does not say anything about "the recent drastic rise", "is known to be" or "entirely due to human activity″ -- was this intended to be the quote requested?
- the first paragraph in the section says "the recent drastic rise in CO2 levels in the atmosphere is known to be entirely due to human activity″ while
- the second paragraph in the section says "Burning fossil fuels such as coal and petroleum is the leading cause of increased anthropogenic CO2" -- which one is right?
- and the {{qn}} has been removed.
- I suggest that the whole first paragraph be rephrased by consensus, removing "drastic" and "is known to be entirely due to human activity″. I further suggest that this rephrasing should be done by 00:00 (UTC) on 15 May 2013, unless someone can provide verification of those statements. --RoyGoldsmith (talk) 00:49, 14 May 2013 (UTC)
- The first and second paragraphs are both correct. Burning fossil fuels is the leading cause, but other significant anthropogenic causes are e.g. cement production and deforestation. If you want to quibble about "recent drastic", we can find another source for that, of course. If you don't understand how the quote I provided supports "entirely due to human activity", re-read it. Anthropogenic emissions are ~6GT/year. The yearly increase in atmospheric carbon is ~3GT. The rest currently is sequestered in the oceans the the terrestrial system. So not only is the increase due to human activity, we are shielded from the full force of our CO2 emissions by the natural sinks (mostly the ocean, which absorbs CO2 and becomes more acidic). And if you want to be polite, I'm not "Mr. Schulz". But Stephan is fine. --Stephan Schulz (talk) 06:06, 14 May 2013 (UTC)
- Where does it say that the yearly increase is 3 gigatons? Is this simply inferred from the statement? Also, simply stating that emissions exceeding the current increase proves that it's the entire cause is fallacious, considering that this amount is dwarfed by other sources mentioned in this article. Stating that this is a major or even primary cause is one thing, but for some reason people who talk about global warming are exceedingly fond of phrases like "entirely due to". There's no need to make up absolutes in order to make a point. The article clearly asserts that mankind is the primary cause, there's no reason to imagine 100% assertions; proper science generally tends to avoid complete absolutes. Not to mention that even smaller inferences of possible disagreements with GW would be shot down immediately, and often rightly so. — Preceding unsigned comment added by 12.45.169.2 (talk) 16:44, 14 May 2013 (UTC)
- Also mentioned in the article is the fact that plant activity shows a marked preference for the carbon dioxide isotopes less common in fossil fuels, meaning a major source of sequestration absorbs and stores the carbon dioxide produced by natural processes more than those produced by human activity. While the isotope ratios from natural sources can help demonstrate the level of contribution from human activity, doesn't this preference also produce some degree of bias in the atmospheric readings, since anthropogenic carbon dioxide is less likely to be extracted from the atmosphere? — Preceding unsigned comment added by 12.45.169.2 (talk) 21:07, 23 May 2013 (UTC)
- I think you are confused. (Most) plants prefer lighter isotopes of carbon. But fossil fuels, which ultimately come from plant matter (sometimes via animal matter, but plants are the primary producers) are already relatively depleted in 13C. Moreover, plants only have a slight preference for lighter isotopes, and 12C makes up nearly 99% of all carbon on Earth to begin with. Thus, this effect is measurable (see Suess effect), but it is quite small as far as carbon fluxes are concerned. But this is a bit besides the point. If you fill a bathtub with a hose, the overflow is caused by the hose, even if most of the water in the bathtub (and hence most of the water that overflows) was already in the tub before you turned on the hose. The increase is anthropogenic, wether all the extra CO2 is, or wether the anthropogenic CO2 fills natural sinks so that more "natural" CO2 remains in the air. --Stephan Schulz (talk) 21:33, 23 May 2013 (UTC)
- I think this graph puts what the cited sources say nicely into perspective. Yes, there have been fluctuations in atmospheric CO2 since forever, but we're talking about that vertical line up the right-hand axis. The level reached is unprecedented in millions of years, but also so is the rate of change, as well as the sustained rate of change. Never in the past 800,000 years has such a huge, rapid and sustained change in atmospheric CO2 happened, probably never before in the history of the Earth. That is the bit that is entirely due to human activity and referred to as such in papers like Gosh et al. --Nigelj (talk) 22:03, 23 May 2013 (UTC)
- Like. This should be engraved on Mt Rushmore. (only half joking!) Plantsurfer (talk) 22:51, 23 May 2013 (UTC)
- I was only asking a question here concerning that, but regardless of how strong the evidence is that we were the primary cause, and I don't disagree that we were the main cause of the current CO2 levels, the article does not say anything about absolutes, that human activity is the only cause. And science in general is not fond of absolutes. I recognize that human activity is the number one cause; but it's not appropriate to use words asserting absolutes in a scientific article. There is no real decrease in the significance to say that human activity is the primary cause rather than the only one, only an increase in scientific accuracy and accuracy to what was stated in the cited source. — Preceding unsigned comment added by 76.30.50.240 (talk) 15:28, 24 May 2013 (UTC)
- Like. This should be engraved on Mt Rushmore. (only half joking!) Plantsurfer (talk) 22:51, 23 May 2013 (UTC)
- I think this graph puts what the cited sources say nicely into perspective. Yes, there have been fluctuations in atmospheric CO2 since forever, but we're talking about that vertical line up the right-hand axis. The level reached is unprecedented in millions of years, but also so is the rate of change, as well as the sustained rate of change. Never in the past 800,000 years has such a huge, rapid and sustained change in atmospheric CO2 happened, probably never before in the history of the Earth. That is the bit that is entirely due to human activity and referred to as such in papers like Gosh et al. --Nigelj (talk) 22:03, 23 May 2013 (UTC)
- I think you are confused. (Most) plants prefer lighter isotopes of carbon. But fossil fuels, which ultimately come from plant matter (sometimes via animal matter, but plants are the primary producers) are already relatively depleted in 13C. Moreover, plants only have a slight preference for lighter isotopes, and 12C makes up nearly 99% of all carbon on Earth to begin with. Thus, this effect is measurable (see Suess effect), but it is quite small as far as carbon fluxes are concerned. But this is a bit besides the point. If you fill a bathtub with a hose, the overflow is caused by the hose, even if most of the water in the bathtub (and hence most of the water that overflows) was already in the tub before you turned on the hose. The increase is anthropogenic, wether all the extra CO2 is, or wether the anthropogenic CO2 fills natural sinks so that more "natural" CO2 remains in the air. --Stephan Schulz (talk) 21:33, 23 May 2013 (UTC)
- The first and second paragraphs are both correct. Burning fossil fuels is the leading cause, but other significant anthropogenic causes are e.g. cement production and deforestation. If you want to quibble about "recent drastic", we can find another source for that, of course. If you don't understand how the quote I provided supports "entirely due to human activity", re-read it. Anthropogenic emissions are ~6GT/year. The yearly increase in atmospheric carbon is ~3GT. The rest currently is sequestered in the oceans the the terrestrial system. So not only is the increase due to human activity, we are shielded from the full force of our CO2 emissions by the natural sinks (mostly the ocean, which absorbs CO2 and becomes more acidic). And if you want to be polite, I'm not "Mr. Schulz". But Stephan is fine. --Stephan Schulz (talk) 06:06, 14 May 2013 (UTC)
- I am certainly not an expert here but...
- Page 2. "In contrast, current annual fossil fuel burning amounts to about 6 Gt of carbon. About half of this amount is observed as an increase of the atmospheric CO2 concentration. The other half is sequestered by other compartments. Currently, both the oceans and the terrestrial system show a net uptake of carbon." --Stephan Schulz (talk) 16:20, 13 May 2013 (UTC)
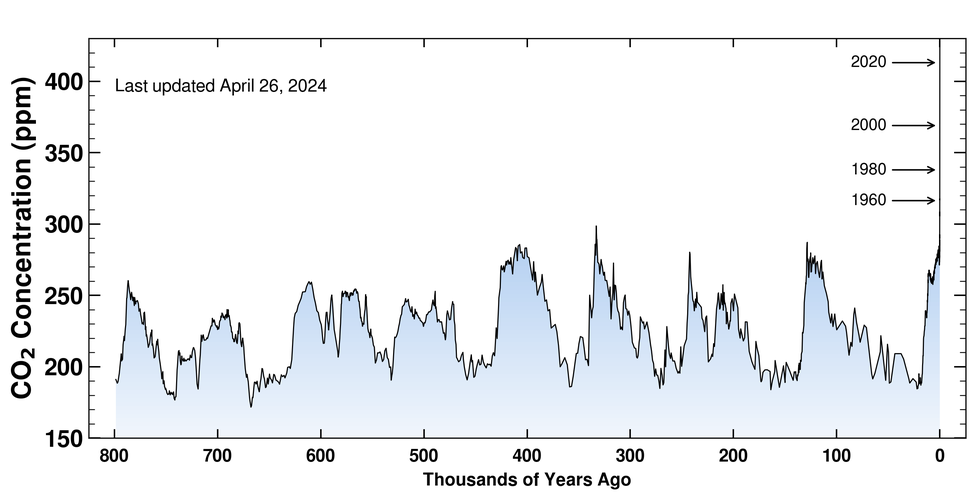
400ppm with stagnant wind blowing co2 from volcano directly into sensor..
The NOAA Mona Loa observatory is located on the side of active mona loa volcano. Adjacent, is Kilauea, which releases 300 tonnes per day of CO2 and other gasses. On the day of the report, winds were stagnant in the area and blowing the entire gas plumes of the active volcanoes directly into the NOAA Observatory sensor. It is rare that both low and high altitude winds go in this direction, happens only a few times per year, and on this occasion it continued for a week. This false report is the equivalent of sticking the sensor in the volcano and noticing there is gas coming out. — Preceding unsigned comment added by 24.43.201.210 (talk) 06:12, 13 May 2013 (UTC)
- Citation needed. The Keeling curve article notes that the observatory is above an inversion level which prevent volcanic contamination from reaching the peak. Please document your assertion. Otherwise it must be rejected as original research. Sailsbystars (talk) 06:54, 13 May 2013 (UTC)
- It also fails the "do you really think all scientists are idiots" test. Even if you're one of those convinced for whatever reason that all env sci nowadays is so politicised that people are deliberately lying to you... do you really think that was true in 1956 when these measurements started? Do you really think Keeling was dumb enough not to know that ML is a volcano? Are you really so arrogant as to think that this brilliant insight you've just had wasn't already considered? William M. Connolley (talk) 20:36, 13 May 2013 (UTC)
Data left out.
This page seems quick to point out how human's increase CO2 emissions, but left out the numbers.
Human's account for 3.225% of all CO2 emissions, yet CO2 emissions increased much higher than that. In fact, the math can be done using the number on this Global Warming Advocate site. http://www.skepticalscience.com/human-co2-smaller-than-natural-emissions.htm
I should note that I do believe in Global Warming, so don't think I'm in denial or something. — Preceding unsigned comment added by 2602:306:CDFC:D5B0:5D54:DA0:89FD:D7FE (talk) 20:13, 7 August 2013 (UTC)
- Sorry, I don't quite understand your question (or comment, or request). Human emissions are a comparatively small part of the global carbon cycle, but they are responsible for all (with the reservation that absolute statements always have in science) of the increase of atmospheric CO2 (actually, we emit more than what ends up in the atmosphere, the rest being absorbed by natural sinks, mostly the oceans). Are you confusing percent of carbon flux with parts-per-million in the atmosphere? --Stephan Schulz (talk) 03:58, 8 August 2013 (UTC)
- I think I understand the question - its the one you've answered. It is, however, a common denialist talking point, so if sensible people are left wondering about it we should make some attempt to work it into the article. I've often thought it unfortunate that the Rules here make it difficult to include a useful "FAQ" section to articles.
- Oh, and 2602..D7FE: please don't call SS a "Global Warming Advocate" site. AFAIK, they're actually opposed to GW :-) William M. Connolley (talk) 07:23, 8 August 2013 (UTC)
File:Global Atmospheric CO2 Historic.jpg

Graph showing historic atmospheric CO2 concentrations (from Antarctic ice cores) and recent atmospheric CO2 concentrations (from Hawaii air)--J. D. Redding 05:34, 17 August 2013 (UTC)
Missing topics
Hi,
maybe one could add the following aspects:
- This paper describes the CO2-rise caused by the movement of india across the oceans followed by a drop caused by the collision of India with asia.Kent, Dennis V. (2008). "Equatorial convergence of India and Early Cenozoic climate trends" (html). Proc. Natl Acad. Sci. 105 (42): 16065–16070. doi:10.1073/pnas.0805382105. Retrieved 2013-09-21.
{{cite journal}}: Cite has empty unknown parameters:|quotes=and|month=(help); Unknown parameter|coauthors=ignored (|author=suggested) (help)
- The azolla event could be mentioned as one cause of a shrinking CO2-content at this time.
- The spikes of the CO2 or methane content of the atmosphere during the Paleocene–Eocene Thermal Maximum and the Eocene Thermal Maximum 2 could also be mentioned.
- The point at which the Wood-decay fungus appeared in earths history - the end of the Carboniferous - reduced the rate at which coal was created.
- Also missing: measurements of the oxygen content of the atmosphere can also be used as a proof that humanity, not volcanoes rise the CO2-content in the air.
- I think these aspects are all worth to be mentioned here. --Hg6996 (talk) 20:19, 1 October 2013 (UTC)
"Is" or "appears to be"?
I just reverted an edit that used the words "appears to be" instead of "is" in the phrase, "The present level is the highest in the past 800,000 years". The cited source says, "Carbon dioxide levels are substantially higher now than at any time in the last 800,000 years, the latest study of ice drilled out of Antarctica confirms." That justifies "is" or "are" for me. I think if there is some doubt about this, then we'll need a new source that expresses the doubt here first. --Nigelj (talk) 19:39, 18 March 2014 (UTC)
- The source also reads,"The in-depth analysis of air bubbles trapped in a 3.2km-long core of frozen snow shows current greenhouse gas concentrations are unprecedented." So the article is talking about Ice cores, specifically Antarctic ice cores, and reconstructions based on ice cores is only one of several mechanisms to reconstruct paleo-climates....plant stomata and Greenland ice cores come to mind. The truth is that the science is not as clean once you start referencing Greenland ice cores or paleo plant stomata. The problem is that from that one article one ice cores and one set of studies the editors who made the change from "appears to be" to "is" is using inductive reasoning to reach certainty and he knows better because he is smart. I'd be ok with saying that "According to Antarctic ice core climate reconstructions from 2006, CO2 levels were determined to be the highest that they have been in 800,000 years." That would be closer to reality. I'm not going to edit war over this but it's academically nebulous to use inductive reasoning to claim certainty. That's why the term "appears to be" is what was in the article before WMC made his edit to use the more certain term "is." Now don't get me wrong, I'm of the mind that CO2 levels are very likely higher than they have been in 800,000 years it's just that we're not being precise and we're using faulty logic and we know better. As always, I'm open to being corrected or to revise my thinking as I read more.-Justanonymous (talk) 20:47, 18 March 2014 (UTC)
- You are confused about induction. We don't deduce (or induce) the claim - the BBC makes the claim. Unless you have good sources with a different opinion, "is" is appropriate. I've not seen respectable studies that contradict the 800000 year claim - and in fact, every time a new study comes out it tends to confirm the result, and often to extend the time range. --Stephan Schulz (talk) 23:44, 18 March 2014 (UTC)
- Respectfully, no I'm not confused - the accusation is not welcome. One ice core study does not make something an established fact. It is exactly one study. Mind you, a very substantial study and well respected and one that I happen to agree with. Still, it's not appropriate to label something as a fact just because of one study. We can say that "according to the study the levels are the highest" but we can't just categorically make the statement. If I recall correctly, you were on the other side of the argument with me on a very similar point a few years ago. Where you wanted me to label where a source came from in-line.....why the opposite tact now? Let's leave the biases outside and do what's right by Wikipedia. -Justanonymous (talk) 23:51, 18 March 2014 (UTC)
- You are confused about induction. We don't deduce (or induce) the claim - the BBC makes the claim. Unless you have good sources with a different opinion, "is" is appropriate. I've not seen respectable studies that contradict the 800000 year claim - and in fact, every time a new study comes out it tends to confirm the result, and often to extend the time range. --Stephan Schulz (talk) 23:44, 18 March 2014 (UTC)
COATRACK
This article appears to be largely a coatrack for Anthropogenic Global Warming. The lede is almost entirely proAGW narrative vs the scientific topic of CO2 in the earth's atmosphere. Roughly 50% of the article's 40,000kb is devoted to AGW material on a topic that should be mostly earth sciences. That's just not appropriate for this very broad topic of CO2 in the earth's atmosphere.
The article should be about CO2 in the earth's atmosphere:
- geologic history (from 4.7bya to today),
- planetary physics (similarities to Venus, Mars other solar system bodies),
- mechanisms used to measure CO2 in the earth's atmosphere (ice cores, plant stomata, other measurement mechanisms that paleoscientists use),
- current state of understanding of scientific knowledge and methods
- importance of CO2 to the biosphere (importance of CO2 to flora and fauna),
- importance of CO2 to keeping the earth warm
- yes there should be mention of recent climb in CO2 rates (but it should not dominate the narrative -- gross violations of WP:Weight and Balance)
Things like that. I'm not going to attempt a rewrite as I think it would start an edit war but the way it is, this is a very poor example of what Wikipedia can be. The way the article is written it's just an AGW coatrack, particularly the intro. Sorry just calling a spade a spade here. -Justanonymous (talk) 21:08, 18 March 2014 (UTC)
- You do realise that "AGW" is part of mainstream science, don't you? --Nigelj (talk) 22:39, 18 March 2014 (UTC)
- Yes of course and absolutely, let's be civil please. The argument I make is that the article is largely about AGW where it shouldn't be and my argument is sensible.-Justanonymous (talk) 22:41, 18 March 2014 (UTC)
- I think your heading is unduly inflammatory. The article is a bit of a jumbled mess, but that's not the same as being a coatrack. It has most of what you're asking for, but it is very poorly organized. I actually agree with the gist of your argument and I think other editors would as well if you didn't put it in such an inflammatory tone... the only part I disagree with is the comparison with other planets, given that this is specifically about Earth's atmosphere. There's a bit about it in the greenhouse effect article (which could use some cleaning up), so other planets should only be mentioned in passing here with a wiki link to the broader treatment elsewhere. Sailsbystars (talk) 01:08, 19 March 2014 (UTC)
- might have overreacted on tone, agree apologies for that. It is more of a mess than a coatrack. Interestingly we don't have an article for oxygen in earths atmosphere, nitrogen in earths atmosphere, or argon in earths atmosphere. Now we do have a geological history of oxygen article....so we could in theory split this article and have a present day co2 and the atmosphere article and a geologic article. We don't just need to fix this article but also the broader organization of where it fits. -Justanonymous (talk) 01:34, 19 March 2014 (UTC)
- I think your heading is unduly inflammatory. The article is a bit of a jumbled mess, but that's not the same as being a coatrack. It has most of what you're asking for, but it is very poorly organized. I actually agree with the gist of your argument and I think other editors would as well if you didn't put it in such an inflammatory tone... the only part I disagree with is the comparison with other planets, given that this is specifically about Earth's atmosphere. There's a bit about it in the greenhouse effect article (which could use some cleaning up), so other planets should only be mentioned in passing here with a wiki link to the broader treatment elsewhere. Sailsbystars (talk) 01:08, 19 March 2014 (UTC)
- Yes of course and absolutely, let's be civil please. The argument I make is that the article is largely about AGW where it shouldn't be and my argument is sensible.-Justanonymous (talk) 22:41, 18 March 2014 (UTC)
60-70%?
I'm confused about this edit. Where does the range come from? I cannot find the numbers in Ocean acidification - it contains the different claim that 30–40% of the carbon dioxide released by humans dissolves into oceans, but, of course, there are additional CO2 sinks, so you cannot simply assume that 30-40% into the oceans translates to 60-70% into the atmosphere. We also did not have a clear source for the 57% - maybe someone can dig up the source? --Stephan Schulz (talk) 23:50, 18 March 2014 (UTC)
- I was confused as well. I read 57% and could not find anything to back that statement. It was worrisome because it said "about 57%" seems contradictory....how can you be so precise with 57%. To me if you write about 57%, you imply that it's between 57.1 and 57.9%. Reading the acidification article, I can only find broad ranges but I'm not entirely certain those are correct either. I went with what the acidification article implied -- which might be incorrect. --Justanonymous (talk) 23:53, 18 March 2014 (UTC)
- I'll put the direct claim that is in the ocean acidification page into this article's page. That way the statement will be factually and 100% in-line. Let me know if you disagree.-Justanonymous (talk) 00:04, 19 March 2014 (UTC)
- I'm also fine with the 57% if there is really a reliable source for that. This is the only thing I found at skeptical science which might lead somewhere but I don't have time to dig.
https://www.skepticalscience.com/co2-residence-time.htm do a search for 57%. -Justanonymous (talk) 00:13, 19 March 2014 (UTC)
From the IPCC Third Assessment Report (admittedly dated, but it probably hasn't that changed much), the emissions from 1989 to 1998 were 7.9 GtC/yr (6.3 fossil fuels and cement, 1.6 land use change). Of that, 2.3 +/- 0.5 GtC/yr went to the oceans, 2.3 +/- 1.3 GtC/yr went to the biosphere, and 3.3 +/- 0.1 GtC/yr remained in the atmosphere. [18] In rough terms, that translates to 30% oceans, 30% biosphere, and 40% atmosphere. Those percentages will change some over time, and it is not uncommon for people to say that about half of the CO2 stays in the atmosphere (somewhat above the IPCC number), but I don't think 60-70% is a realistic number for the atmospheric fraction. Also, this applies to the short-term fraction. On time scales longer than the ~1000 yr ocean mixing time, the ocean swallows 80-90% of the emissions, leaving only 5-15% in the air. Dragons flight (talk) 00:19, 19 March 2014 (UTC)
- Our ocean acidification article reads that 30-40% of the carbon dioxide released into the atmosphere is absorbed by the oceans (timescale is not given). I copied and pasted that statement into this article to satisfy the correct statement from Stephan that we can't just assume the inverse that 30 goes into oceans but that 70 stays. Do you think that the 30% to 40% from the acidification pages is in line with the third assessment? The statement has two sources attributing 30-40% going to the oceans.-Justanonymous (talk) 00:26, 19 March 2014 (UTC)
Large changes to lede
I hope when Justanonymous (talk · contribs) says, "We're improving the article, several editors have already commented on talk. You don't own Wikipedia. Feel free to improve but not just revert," they do not include me, in those who have "commented on talk", as if in any way I approve of the changes they have tried to make. When they say "We're improving the article", it's worth pointing out all the changes made since the last stable version, have been made by Justanonymous, except for where Stephan Schulz and I have reverted them, and BG19bot has fixed their formatting errors. In short, apart from its WP:BATTLEGROUND tone ("You don't own Wikipedia" indeed!), this is a thoroughly misleading edit summary.
Referring to the content,
- The new statement "In very recent geologic times (during the 21st century), the concentration of carbon dioxide has increased markedly" is very clearly incorrect as shown by the graph beside the text: there is no marked change in the rate of increase since 2000. Any such statement should refer to a timescale involving the Industrial Revolution.
- The very long sentence that can be simplified to "CO2 is ... important ... because it absorbs and emits infrared radiation ... thereby playing a vital role in the greenhouse effect which is crucial to plant and animal life [...and...] critical to life ..." is misleading. These would make a good introduction to an article on CO2 in the atmosphere of a planet that was at risk of running out of CO2. However, one of the primary challenges faced by life on Earth this century will be dealing with the effects of human-caused global warming.[19] In the present context, they seem disingenuous to say the least.
Therefore I would like to see the lede reverted to the 17:48, 18 March 2014 version, and any further suggestions for re-wording, or re-purposing, this article made on talk, rather than by edit war. --Nigelj (talk) 15:44, 19 March 2014 (UTC)
- I mostly agree with nigelj's specific misgivings/revisions, but I think that overall Justanonymous' changes are an improvement over the previous version. In the previous version we started off by introducing CO2 as an increasing concentration. in the new version we introduce what it does before we talk about the concentrations etc. By the way, the during the 21st century problem is in the old version too... I'm going to try to improve from the current version. Sailsbystars (talk) 16:20, 19 March 2014 (UTC)
- I think there's plenty of room for improvement in the article. No disrespect to AGW theory and most certainly Yes there is room for AGW science and theory in the article - it's just that the article is not about the the AGW caused greenhouse effect of CO2 in recent human history-- that's a different article. Primarily, to me this article needs to be about Carbon Dioxide in Earth's atmosphere which is a gigantic field that stretches back 4.7 billion years. When I say we've been discussing, I meant the 60-70% section above and the perhaps mislabeled (by me) Coatrack section. The lede before was mangled, one AGW comment, one general science comment -- disorganized to say the least. The way I reorganized it we cover the basic science first and then we cover AGW which is important to recent geologic history. I propose that we do something similar with the rest of the article. Yes, there are some elements that probably need to go --- emissions by country tables likely is overkill and redundant. Not interested in a war, no one person owns this article, I want to respect all our esteemed editors - I'd just like to see the article improve to what it can be.-Justanonymous (talk) 16:33, 19 March 2014 (UTC)
- Nigelj (talk · contribs), on your points 1 and 2, please feel free to fix and improve - it's not my article. On point one, let's make it clearer so it's clear that it's since the 1800s or 1750s or the start of human agriculture. I was simply borrowing from the first lede. On point 2, I borrowed from the first revision. I thought it was a nice technical sentence but please by all means edit it and make it smoother. I don't claim any wiki-ownership. I'm just an editor. -Justanonymous (talk) 16:37, 19 March 2014 (UTC)
- I made some more changes. A few points for further improvement:
- I'm not sure the sentence about plants needs to be in the lede, could use some tweaking
- It would probably be helpful to add a sentence the the lede about target levels for CO2 to avoid catastrophic global warming
- It would also be good to add "well-mixed" somewhere to the first sentence, as we don't explain that the gas is well-mixed anywhere on wikipedia and it's an important point
- might also want to add a sentence or paragraph about geologically historical CO2 levels -- there's some interesting history in that the levels used to be really high before plant life evolved....
- and a bit about forcing vs. feedback would not go amiss either
- Sailsbystars (talk) 16:39, 19 March 2014 (UTC)
- Sailsbystars (talk · contribs) I like where it's going and I like your points. CO2 is critically important to the biosphere and photosynthesis. Without the CO2 life would likely not exist on earth and we wouldn't have a biosphere so I think we have to talk about it at a minimum in the lede and perhaps that CO2 is part of a very big carbon cycle between water, earth, and biosphere - we're talking plants, algae, limestone, volcanic activity (which releases the CO2 back). We need to do this very broad topic justice and I think it could be a wonderful article.-Justanonymous (talk) 16:46, 19 March 2014 (UTC)
- Fair enough. One caveat, we do have a whole article on the carbon cycle about present carbon sources and sinks, so we should think carefully about avoiding duplication with that article while still including relevant information. Sailsbystars (talk) 16:53, 19 March 2014 (UTC)
- Agree, we have to be careful in how we integrate the carbon cycle materials. Right now, we have in effect an ocean-acidification section which is a modern day concern but also a subset of the much longer term carbon dioxides' interaction with the earth's oceans (ie, the formation of limestone etc). I want to do the near term acidification commentary justice but we also need to include the broader carbon cycle to make the discussion complete -- all without duplicating too much. It's going to take some thinking and some work. -Justanonymous (talk) 17:53, 19 March 2014 (UTC)
- Fair enough. One caveat, we do have a whole article on the carbon cycle about present carbon sources and sinks, so we should think carefully about avoiding duplication with that article while still including relevant information. Sailsbystars (talk) 16:53, 19 March 2014 (UTC)
- Sailsbystars (talk · contribs) I like where it's going and I like your points. CO2 is critically important to the biosphere and photosynthesis. Without the CO2 life would likely not exist on earth and we wouldn't have a biosphere so I think we have to talk about it at a minimum in the lede and perhaps that CO2 is part of a very big carbon cycle between water, earth, and biosphere - we're talking plants, algae, limestone, volcanic activity (which releases the CO2 back). We need to do this very broad topic justice and I think it could be a wonderful article.-Justanonymous (talk) 16:46, 19 March 2014 (UTC)
wrong numbers in volcanic release of CO2?
I checked the given source "Present-day CO2 emissions from volcanos" by Terrence M. Gerlach (source 47). The abstract gives a rate between 6-7Exp12 and 11 Exp12 mol/year of C02.
As one mol CO2 is 44 grams, this translates for me into these values 264 tons CO2 (for 6Exp12 mol) and 484 tons of CO2 (for 11Exp12 mol).
Can anyone please confirm that the given numbers in the article (130-230 tons) are not correct ? Thanks --Hg6996 (talk) 06:30, 12 May 2014 (UTC)
- I don't know if that paper is online, but I found a nice overview at the USGS, which cites data from several papers (including Gerlach 1991). --Stephan Schulz (talk) 12:52, 12 May 2014 (UTC)
6-7 to 11*1012 mol yr-1 is the total co2 degassing which includes volcanic,diagenetic and metamorphic sources; volcano co2 according to Gerlach 1991 is estimated to be 3-4*1012 (132-176 megatonnes,still inconsistent with 230). however there is now a wider range of estimates, maybe this 2011 ref would be better: http://onlinelibrary.wiley.com/doi/10.1029/2011EO240001/pdf --Giorgiogp2 (talk) 12:58, 12 May 2014 (UTC)
Biosphere damage above 550ppm
I'm neither a topical expert nor a regular editor of this article. The article is on my watchlist, however, and the edit summary for this recent edit caught my eye. I just want to mention some possibly useful sources I turned up: [20], [21], [22], [23]. Wtmitchell (talk) (earlier Boracay Bill) 04:46, 11 June 2014 (UTC)
article overview - outdated information
In regards to the line "and likely the highest in the past 20 million years.[10]" from the article overview, the source is from 2000. More up to date information suggest that CO2 levels were higher than today at some point in the past 20 million years:
http://rsta.royalsocietypublishing.org/content/371/2001/20130096.short?rss=1
It does not seem overly valuable to make these comparison values from 800,000 or 20 million years ago as much more in the climate has changed than just the CO2. 24.131.254.133 (talk) 17:46, 30 June 2014 (UTC)
- .....That's just one article on observations at one single site. So that alone wouldn't prompt us to change things. However, AR5 also agrees that the 20 MY figure is not as certain as it was and that subsequent paleo observations have trended higher. They state that the 800 kYa max is a fact, but that there's only medium confidence in the CO2 range back to 23MYa (350-450) and that values were higher than preindustrial on two occasions (middle Miocene and Pliocene). Maybe we should actually update the article a bit. Sailsbystars (talk) 18:42, 30 June 2014 (UTC)
Inconsistencies in graphs (which are all unsourced)
 A |
File:Atmospheric CO2 CH4 Degrees Centigrade Over Time by Reg Morrison.jpg B |
 C |
The three graphs to the right have two problems:
- The graphs are inconsistent with each other - A and B show present day CO2 ppmv of about 400, while C seems to show present day value of 3000 ppmv.
- None of them provide sources for the graphs, tho one provides a source for the data in the graph (in the image itself).
Fresheneesz (talk) 21:50, 30 August 2014 (UTC)
- You are misreading the graph. "C" had present day on the left side. All of the graphs appeared sourced. Tom Ruen (talk) 02:13, 31 August 2014 (UTC)
- Fixed this by inverting data and y-axis of Graph C. --Saippuakauppias ⇄ 11:29, 27 August 2019 (UTC)
Misleading Graphs
The graphs of CO2 in this article are misleading. Look at the ordinate scales, they are purposely scaled to make it look like the increase in CO2 is geometric. Either remove the graphs or replace them with properly scaled ones. There are lies, damned lies and statistics! 2001:1970:5324:D600:7DF5:A752:7871:B57F (talk) 11:37, 19 May 2019 (UTC)
Great public domain animation here
Let me know if anyone needs help converting these [24] I use Firefogg on Firefox. These are all public domain.Victor Grigas (talk) 06:10, 20 November 2014 (UTC)
- Here's the first one:
A Year In The Life Of Earth's CO2Narrated Video - Jan. 1, 2006 - Dec. 31, 2006
Article is being used to support the politically active hypothesis that global warming is caused by human CO2 production.
Take the politics somewhere else
|
|---|
|
This article contains many statements that present as fact the hypothesis that humans are warming the earth with CO2 production. This makes the article extremely biased because it does not counter each statement with an alternate view, nor does it acknowledge much about alternative views. It is a deliberate and political act to include these statements, and clearly intended to support the views of a global political movement - rather than to provide unbiased information to the public. This also serves to highlight the reality that Wikipedia is not a reliable source of information, but is subject to being used for the spreading of propaganda - thus bringing disrepute to WIkipedia. 42.118.16.155 (talk) 09:00, 28 January 2015 (UTC)
Yes. The article has a political agenda, and is a waste of time if one simply wants to learn the facts about Co2. Bougatsa42 (talk) 20:55, 5 September 2018 (UTC) |
The current scientific consensus on the "safe operating space for humanity"
I cut this:
- The current scientific consensus on the "safe operating space for humanity" "urges the world to reduce atmospheric carbon dioxide concentration CO2 to about 300 parts per million by volume." [1] As recently as 2007, scientists reasoned that a CO2 concentration of 550 ppm, which is thought to be politically and technically achievable, would likely be insufficient to limit warming per the European Union's official goal of 2 degrees Centigrade.[2]
for a couple of reasons. Firstly, the second ref is https://sites.google.com/site/300orgsite/300-org---return-atmosphere-co2-to-300-ppm/. Say no more. Secondly, the Nature thing doesn't say 300. It proposes 350. But rather more importantly, its just an article in Nature. Which is prestigious and all that, but one article isn't The current scientific consensus. If you could find the IPCC saying that it would be different; but it doesn't, so it isn't William M. Connolley (talk) 22:52, 23 March 2015 (UTC)
References
- ^ Johan Rockström, Will Steffen, Kevin Noone, Åsa Persson, F. Stuart Chapin, III, Eric F. Lambin, Timothy M. Lenton, Marten Scheffer, Carl Folke, Hans Joachim Schellnhuber, Björn Nykvist, Cynthia A. de Wit, Terry Hughes, Sander van der Leeuw, Henning Rodhe, Sverker Sörlin, Peter K. Snyder, Robert Costanza, Uno Svedin, Malin Falkenmark, Louise Karlberg, Robert W. Corell, Victoria J. Fabry, James Hansen, Brian Walker, Diana Liverman, Katherine Richardson, Paul Crutzen & Jonathan A. Foley A safe operating space for humanity Nature, 461, 472-475, 2009, and [1]
- ^ Lazarus, M.; Kartha, S. 2009 (Oct.). Linking Technology Development with Emissions Commitments: Exploring Metrics for Effort and Outcome. Stockholm Environment Institute Working Paper WP-US-0909. (Original Report issued in April, 2007 for the French Environment and Energy Management Agency, ADEME.). See first page of the introduction, at p.13 of the pdf file (aka page 1) .
CO2 in kilograms
I noted the CO2 is expressed in ppm. How much is 400 ppm CO2 in kilograms? That would be more comparable for example to human emissions. --146.211.0.10 (talk) 13:41, 1 September 2015 (UTC)
I also would like to know. And show your work, please. ( Martin | talk • contribs 07:52, 5 April 2019 (UTC))
IF Interested => NASA-TV/ustream and/or NASA-Audio (Thursday, November 12, 2015@12noon/et/usa)[1] - NASA will detail the Role of Carbon on the Future Climate of the Earth - in any case - Enjoy! :) Drbogdan (talk) 14:07, 10 November 2015 (UTC)
- BRIEF Followup - REPLAY LINK (Audio; 66:01)[2][3] => http://www.ustream.tv/recorded/77531778 - Enjoy! :) Drbogdan (talk) 19:53, 12 November 2015 (UTC)
- SUMMARY (and possible addition to article) (see below) - Comments Welcome - Enjoy! :) Drbogdan (talk) 13:06, 14 November 2015 (UTC)
NASA scientists report that human-made carbon dioxide (CO2) continues to increase above levels not seen in hundreds of thousands of years: currently, about half of the carbon dioxide released from the burning of fossil fuels remains in the atmosphere and is not absorbed by vegetation and the oceans.[2][3][4][5]

(NASA simulation; November 9, 2015)
References
- ^ Buis, Alan; Cole, Steve (November 9, 2015). "NASA Holds Media Briefing on Carbon's Role in Earth's Future Climate". NASA. Retrieved November 10, 2015.
- ^ a b Staff (November 12, 2015). "Audio (66:01) - NASA News Conference - Carbon & Climate Telecon". NASA. Retrieved November 12, 2015.
- ^ a b Buis, Alan; Ramsayer, Kate; Rasmussen, Carol (November 12, 2015). "A Breathing Planet, Off Balance". NASA. Retrieved November 13, 2015.
- ^ a b St. Fleur, Nicholas (November 10, 2015). "Atmospheric Greenhouse Gas Levels Hit Record, Report Says". New York Times. Retrieved November 11, 2015.
- ^ a b Ritter, Karl (November 9, 2015). "UK: In 1st, global temps average could be 1 degree C higher". AP News. Retrieved November 11, 2015.
Plant growth
Surely the impact of CO2 on plant growth per se is should be covered. I don't mean in terms of the carbon cycle, or any feedback of plant growth back to CO2 concentrations. I simply mean the direct impact on plant growth. I did some googling and made a very small start to this. I'm sure the topic could use a lot more attention than I am able to give it. CometEncke (talk) 20:02, 12 January 2016 (UTC)
- The effect of CO2 on the 'greening' of the plant is highly topical and significant. Please refer to this NASA article. https://www.nasa.gov/feature/goddard/2016/carbon-dioxide-fertilization-greening-earth The referenced study both shows that increased CO2 is by far the most important factor in increased plant growth (CO2 fertilization accounts for 70% of the observed greening) as well as increasing the carbon sink effects of the earth's land surface. — Preceding unsigned comment added by 165.156.39.52 (talk) 15:22, 21 April 2017 (UTC)
chart outdated
The chart ends in 2011. Surely more recent data are available? CometEncke (talk) 19:18, 16 January 2016 (UTC)
- Which chart, specifically? The article has a whole bunch. Shock Brigade Harvester Boris (talk) 19:59, 16 January 2016 (UTC)
- 2011 carbon dioxide mole fraction in the troposphere CometEncke (talk) 20:01, 16 January 2016 (UTC)
- Yes, that one's a few years old. You're welcome to replace it with an updated plot. Shock Brigade Harvester Boris (talk) 21:29, 16 January 2016 (UTC)
Sentence about the rate of increase
I just rewrote the sentence about the rate of increase as follows. (It was formerly one sentence but is now two.)
During the period 2006-2016, it rose by an average of 2.1 ppm/year. Over long time periods, the increase has been accelerating; over short time periods, the data are too noisy to be sure.
This came from routine calculation from the raw data:
| year | level (first weekly measurement) |
|---|---|
| 1966 | 319.69 |
| 1976 | 331.57 |
| 1986 | 346.44 |
| 1996 | 361.81 |
| 2006 | 381.28 |
| 2016 | 402.25 |
The reasons I felt this was better than the prior formulation: first of all, when we have the raw data, and the calculation leads directly to 2.1 ppm/year instead of 2, I see no reason not to use it. Next, about acceleration. As one can easily see from the raw data above, there is a long-term trend of acceleration. However, the data are noisy. If one looks year to year, the noise overwhelms any acceleration. From the chart above, in any 10-year period, the increase is greater than that of the previous 10-year period. But if one looks at 1-year periods, or even 2 or 3 years, the noise is so great that one can't tell if it is accelerating or not. CometEncke (talk) 16:11, 7 February 2016 (UTC)
- Reverted. This is simply an example of the fact that one cannot cannot compute reliable statistics using a very small sample size, whether it's climate trends, agricultural production, or heads-vs-tails in coin tosses. There's no reason to imply that this is somehow unique or especially relevant to CO2. Shock Brigade Harvester Boris (talk) 16:18, 7 February 2016 (UTC)
- Hi, no intention to imply anything unusual or underhanded here. Is the mention of noisy data what bothers you? The data are what they are, but I would have no objection to leaving that part out, with something like this: During the period 2006-2016, it rose by an average of 2.1 ppm/year. When viewed over decadal time periods, the increase has been accelerating. How does that work for you? CometEncke (talk) 17:03, 7 February 2016 (UTC)
- Sorry, no implication of being underhanded was meant. Just noting the general principle. What you're proposing is essentially benign though a perhaps a little too close to WP:OR. Better to cite a published source that makes the same or similar point. Shock Brigade Harvester Boris (talk) 23:38, 7 February 2016 (UTC)
- Hi, no intention to imply anything unusual or underhanded here. Is the mention of noisy data what bothers you? The data are what they are, but I would have no objection to leaving that part out, with something like this: During the period 2006-2016, it rose by an average of 2.1 ppm/year. When viewed over decadal time periods, the increase has been accelerating. How does that work for you? CometEncke (talk) 17:03, 7 February 2016 (UTC)
A value of 2.1 (rather than 2) gives an implied error of +/- .05. Whereas a value of 2 is commonly thought of as 2 having a confidence of .5. ( Martin | talk • contribs 07:49, 5 April 2019 (UTC))
recent addition to plant growth section
The following was recently added [25]:
The impact on the biosphere was also recently studied in European coniferous ecosystems using isotopic 13C techniques and the results confirmed that the tree-ring 13C composition can be an indicator of ecophysiological dependences during photosynthetic CO2 uptake, reflecting the biome sensitivity to atmospheric changes
My concern with this is that it doesn't tell the reader much. OK, there is biome sensitivity to atmospheric changes. But what does that sensitivity consist of? Similarly, it says there are dependencies. But what are they? The problem I'm having is that a statement of the existence of dependencies and sensitivity is not particularly helpful information, unless there is a description of what they consist of and an explanation of their importance. That said, a non-particularly-interesting abstract could simply suggest a not-particularly-interesting article, in which case I'm not clear it belongs in this article at all. Note that the rest of the plant-growth section consists of widely-cited studies (and groups of studies), where as this is just one study that says I'm-not-sure-what.CometEncke (talk) 05:48, 18 February 2016 (UTC)
- It actually does mean something if you're already knowledgeable about the subject, but it's not helpful in a general-purpose encyclopedia article. Zot. Shock Brigade Harvester Boris (talk) 01:12, 19 February 2016 (UTC)
- zing* noted. Everyone brings something different to the table. At any rate, that appears to be agreement to take it out, which you already did, thanks.CometEncke (talk) 10:50, 19 February 2016 (UTC)
Moving of the mass-concentration conversion
I notice that the sentence "each part per million by volume represents approximately 2.13 gigatonnes of carbon in the atmosphere as a whole" was recently moved. It was formerly very early in the article, and is now somewhat later. I'm not sure if I agree with the move or not. I do want to note two issues. First of all, that's basic information, which suggests it belongs right up at the front. A subtler issue is that the sentence implicitly assumes current atmospheric pressure. The source does not say that, but basic logic does. If the sentence is at the top of the article, that's not much of an issue, as the top of the article is focussed on recent events (as in the last few thousand years). But as one goes further back, the validity of that assumption rapidly becomes questionable. I tried to do some googling on the history of atmospheric pressure and came up darn near empty. It seems possible that said history is simply unknown.CometEncke (talk) 16:44, 20 February 2016 (UTC)
may I ask a question: the notion of using volume (ppm by volume) seems quite unworkable, as opposed to by mass. It means, doesnt it, that you can define the edge of the atmosphere, in order to calculate the enclosed volume, and that each cubic meter can meaningfully be compared to any other cubic meter. ( Martin | talk • contribs 07:44, 5 April 2019 (UTC)).
Added section on ongoing measurements
I added a section on ongoing real-time measurements. The purpose it to highlight how measurements are made and where to find data. I also think it would be helpful to add to this section as new satellite missions are approved. If there are problems with this section, I propose to place the discussion here. Jacobkhed (talk) 23:39, 5 March 2016 (UTC)
Proposed rename "Atmospheric carbon dioxide and global warming" to "Anthropogenic CO2 emissions"
I propose the section Atmospheric carbon dioxide and global warming be renamed to something like "Anthropogenic CO2 emissions." This already seems to be the focus of the section. I also propose to move a small amount of content to the Atmospheric carbon dioxide and the greenhouse effect section such as the radiative forcing change since pre-industrial times figure. I don't mind making the changes myself if there is no major opposition. Jacobkhed (talk) 00:05, 6 March 2016 (UTC)
Stephan Schulz, since when is accuracy about assumptions is not an important improvement?
The changes you reverted accurately reflect the source. The assumption in the calculation of the source was no atmosphere, and a planetary albedo of 0.3. Do you think the earth would still have clouds without an atmosphere or might the albedo be closer to the 0.09 of the ocean? Assumptions are important. Poodleboy (talk) 16:29, 14 August 2016 (UTC)
- Unnecessary complications are not, however. We don't usually specify everything that does not change in an argument. And we don't invent "usually attributed", either. --Stephan Schulz (talk) 16:38, 14 August 2016 (UTC)
- It is no more an invention than converting without an atmosphere to "Without the greenhouse effect". We can compromise by removing "usually". Too bad we can't get a peer reviewed source instead of some class notes. Poodleboy (talk) 16:52, 14 August 2016 (UTC)
- "greenhouse effect" is simpler and clearer especially to the layperson. Poodleboy's last edit overly complicates and brings unnecessary information here. I undid Poodleboy's edit back to the previous versions. I see no reason to add anything about "albedo". Jim1138 (talk) 06:53, 16 August 2016 (UTC)
- The "greenhouse effect" is still in there. Failing to mention the albedo is indicative of a larger problem with article, it gives the overall impression that the this difference is due to CO2, when the contributions of water vapor and clouds to the effect are greater. The Smil source is particularly negligent in not mentioning the contribution of clouds given the prominent role in the effect they are given by the IPCC.Poodleboy (talk) 08:30, 16 August 2016 (UTC)
- As Stephan Schulz and ThePlatypusofDoom seem to indicate, it is not helpful. To me, it obfuscates the issue. Jim1138 (talk) 01:18, 17 August 2016 (UTC)
- Not ready for a vote yet. FYI, the appropriateness of the source the text in question relies upon has become the subject of discussion on the global warming talk page. [26] Poodleboy (talk) 03:17, 17 August 2016 (UTC)
- In Wikipedia we don't vote, except for elections. Newbies are often confused by one way we try to sort out the articulated reasons for/against a proposal. You can read about that poorly named process at WP:!VOTE. See also Wikipedia:Closing_discussions.... NewsAndEventsGuy (talk) 19:59, 17 August 2016 (UTC)
- Please refrain from namecalling. Poodleboy (talk) 22:17, 17 August 2016 (UTC)
- If something about my attempt at providing guidance regarding our WP:Consensus process was offensive, I apologize. NewsAndEventsGuy (talk) 22:38, 17 August 2016 (UTC)
- Please refrain from namecalling. Poodleboy (talk) 22:17, 17 August 2016 (UTC)
- In Wikipedia we don't vote, except for elections. Newbies are often confused by one way we try to sort out the articulated reasons for/against a proposal. You can read about that poorly named process at WP:!VOTE. See also Wikipedia:Closing_discussions.... NewsAndEventsGuy (talk) 19:59, 17 August 2016 (UTC)
- Not ready for a vote yet. FYI, the appropriateness of the source the text in question relies upon has become the subject of discussion on the global warming talk page. [26] Poodleboy (talk) 03:17, 17 August 2016 (UTC)
- As Stephan Schulz and ThePlatypusofDoom seem to indicate, it is not helpful. To me, it obfuscates the issue. Jim1138 (talk) 01:18, 17 August 2016 (UTC)
- The "greenhouse effect" is still in there. Failing to mention the albedo is indicative of a larger problem with article, it gives the overall impression that the this difference is due to CO2, when the contributions of water vapor and clouds to the effect are greater. The Smil source is particularly negligent in not mentioning the contribution of clouds given the prominent role in the effect they are given by the IPCC.Poodleboy (talk) 08:30, 16 August 2016 (UTC)
- "greenhouse effect" is simpler and clearer especially to the layperson. Poodleboy's last edit overly complicates and brings unnecessary information here. I undid Poodleboy's edit back to the previous versions. I see no reason to add anything about "albedo". Jim1138 (talk) 06:53, 16 August 2016 (UTC)
- It is no more an invention than converting without an atmosphere to "Without the greenhouse effect". We can compromise by removing "usually". Too bad we can't get a peer reviewed source instead of some class notes. Poodleboy (talk) 16:52, 14 August 2016 (UTC)
Addressing the issue with the source would be more appreciated.Poodleboy (talk) 22:46, 17 August 2016 (UTC)
-18C without greenhouse effect difference -- citation needed
Per above discussion and the discussion that was referenced at the Global Warming talk page, the current unreferenced Columbia class notes source for this point is inadequate for the wikipedia reference standards. Poodleboy (talk) 12:50, 18 August 2016 (UTC)
External links modified
Hello fellow Wikipedians,
I have just modified 2 external links on Carbon dioxide in Earth's atmosphere. Please take a moment to review my edit. If you have any questions, or need the bot to ignore the links, or the page altogether, please visit this simple FaQ for additional information. I made the following changes:
- Added archive https://web.archive.org/web/20111216001323/http://www.globalcarbonproject.org/carbonbudget/09/hl-full.htm to http://www.globalcarbonproject.org/carbonbudget/09/hl-full.htm
- Added
{{dead link}}tag to http://www.jameslovelock.org/page33.html/ - Added archive https://web.archive.org/web/20070502220650/http://www.gcrio.org:80/ipcc/qa/05.html to http://www.gcrio.org/ipcc/qa/05.html
- Added
{{dead link}}tag to http://www.lsce.ispl.fr/
When you have finished reviewing my changes, please set the checked parameter below to true or failed to let others know (documentation at {{Sourcecheck}}).
This message was posted before February 2018. After February 2018, "External links modified" talk page sections are no longer generated or monitored by InternetArchiveBot. No special action is required regarding these talk page notices, other than regular verification using the archive tool instructions below. Editors have permission to delete these "External links modified" talk page sections if they want to de-clutter talk pages, but see the RfC before doing mass systematic removals. This message is updated dynamically through the template {{source check}} (last update: 18 January 2022).
- If you have discovered URLs which were erroneously considered dead by the bot, you can report them with this tool.
- If you found an error with any archives or the URLs themselves, you can fix them with this tool.
Cheers.—InternetArchiveBot (Report bug) 00:24, 15 November 2016 (UTC)
External links modified
Hello fellow Wikipedians,
I have just modified one external link on Carbon dioxide in Earth's atmosphere. Please take a moment to review my edit. If you have any questions, or need the bot to ignore the links, or the page altogether, please visit this simple FaQ for additional information. I made the following changes:
- Added archive https://web.archive.org/web/20061109125803/http://www.eia.doe.gov:80/pub/international/iealf/table18.xls to http://www.eia.doe.gov/pub/international/iealf/table18.xls
When you have finished reviewing my changes, you may follow the instructions on the template below to fix any issues with the URLs.
This message was posted before February 2018. After February 2018, "External links modified" talk page sections are no longer generated or monitored by InternetArchiveBot. No special action is required regarding these talk page notices, other than regular verification using the archive tool instructions below. Editors have permission to delete these "External links modified" talk page sections if they want to de-clutter talk pages, but see the RfC before doing mass systematic removals. This message is updated dynamically through the template {{source check}} (last update: 18 January 2022).
- If you have discovered URLs which were erroneously considered dead by the bot, you can report them with this tool.
- If you found an error with any archives or the URLs themselves, you can fix them with this tool.
Cheers.—InternetArchiveBot (Report bug) 13:29, 2 January 2017 (UTC)
CO2 potency
The statement that CO2 is a potent greenhouse gas is false.
Infact CO2 is the least potent greenhouse gas...
Can this be corrected? Kshla (talk) 15:44, 7 June 2017 (UTC)
- Source? --Hob Gadling (talk) 07:45, 20 June 2017 (UTC)
- The comment is sort-of fair. CO2, per molecule, is less potent than, say methane. So calling it "potent" is odd. OTOH, calling it the "least potent" is also odd, because there are any number of other gases (which I couldn't name) that are present in trace quantities but are per-molecule less potent than CO2.
- But, who cares? The point, as far as the lede is concerned, is that it's important; so I've switched to "major" and removed the despite William M. Connolley (talk) 08:01, 20 June 2017 (UTC)
Current CO2 concentration
I see the first line of the summary reports that current CO2 conc is about 410 ppm (but cites references that are 2 years out of date!); but in the first section of the body of the article (headed "Current concentration") the concentration is reported as 400 ppm, based on IPCC AR5, 2013. I want to see these two values (and any other reports of "current CO2 concentration" updated and unified. I'd like to suggest that this might be best handled by links to a reliable website reporting current CO2 concentration. How about: https://scripps.ucsd.edu/programs/keelingcurve/ or, possibly https://www.esrl.noaa.gov/gmd/ccgg/trends/
Also, here is a more up-to-date reference that could be used, at least for now: Le Quere et al. 2016. Global carbon budget 2016. Earth Syst. Sci. Data, 8, 605–649, www.earth-syst-sci-data.net/8/605/2016/ doi:10.5194/essd-8-605-2016
Dtprice (talk) 23:30, 19 June 2017 (UTC)
CO2 emissions of animals and people
Perhaps useful to write something about this in the current article ? See Talk:Greenhouse_gas#Sectors KVDP (talk) 09:04, 25 June 2017 (UTC)
- By coincidence, I ask whether the net emission of CO2 by the breathing of humanity is a significant source of CO2 on the first day of my climate survey course. The answer is "no." It is more of a problem in critical thinking than in science per se. Hint: it doesn't matter how big the value is. Shock Brigade Harvester Boris (talk) 12:46, 2 August 2017 (UTC)
"CO2 is a major greenhouse gas "

This sentence is essentially wrong: H2O is a major greenhouse gas. CO2 is quite week greenhouse gas compared to water. See greenhouse gas. — Preceding unsigned comment added by 130.60.94.208 (talk) 12:38, 16 August 2017 (UTC)
External links modified
Hello fellow Wikipedians,
I have just modified 2 external links on Carbon dioxide in Earth's atmosphere. Please take a moment to review my edit. If you have any questions, or need the bot to ignore the links, or the page altogether, please visit this simple FaQ for additional information. I made the following changes:
- Added archive https://web.archive.org/web/20100218095548/http://co2unting.com/ to http://co2unting.com/
- Added archive https://web.archive.org/web/20120723220134/http://www.tyndall.ac.uk/global-carbon-budget-2010 to http://www.tyndall.ac.uk/global-carbon-budget-2010
When you have finished reviewing my changes, you may follow the instructions on the template below to fix any issues with the URLs.
This message was posted before February 2018. After February 2018, "External links modified" talk page sections are no longer generated or monitored by InternetArchiveBot. No special action is required regarding these talk page notices, other than regular verification using the archive tool instructions below. Editors have permission to delete these "External links modified" talk page sections if they want to de-clutter talk pages, but see the RfC before doing mass systematic removals. This message is updated dynamically through the template {{source check}} (last update: 18 January 2022).
- If you have discovered URLs which were erroneously considered dead by the bot, you can report them with this tool.
- If you found an error with any archives or the URLs themselves, you can fix them with this tool.
Cheers.—InternetArchiveBot (Report bug) 05:51, 22 September 2017 (UTC)
Impact on plant growth
I added information about earth getting greener for the past 35 years and the edit was reverted, because 1) poor intro and 2) not clear what greener is. I reverted the revert and made it more clear what greener is. In terms of poor intro, this information is fact, while the rest is theory. Perhaps the section should be split up into two subsections of reality and theory. Daniel.Cardenas (talk) 19:23, 4 February 2018 (UTC)
- This material is worth including, but needs to be integrated with the rest of the section. Just sticking it in as the very first sentence is jarring. It should also cite the original paper in Nature rather than the press release. Shock Brigade Harvester Boris (talk) 19:52, 4 February 2018 (UTC)
- I agree. I don't dispute the general idea, but as I said in my original removal of the first time it was added, not clear what "greener" means, and poor intro for this section anyway". To expand upon that second detail, it's not the main topic of the §Impact on plant growth section. DMacks (talk) 19:54, 4 February 2018 (UTC)
- Greener means positive impact on plant growth. As far as edit war, it takes two to tango. Daniel.Cardenas (talk) 20:18, 4 February 2018 (UTC)
- Not quite. The original Nature article gives a specific and quantitative definition of what "greening" means in this case. Did you read it? Shock Brigade Harvester Boris (talk) 20:30, 4 February 2018 (UTC)
- Here is what I see from: https://phys.org/news/2016-04-co2-fertilization-greening-earth.html :
- The greening represents an increase in leaves on plants and trees.
- To me this directly translates to increased plant growth. What are you seeing? Daniel.Cardenas (talk) 20:33, 4 February 2018 (UTC)
- Here is what I see from: https://phys.org/news/2016-04-co2-fertilization-greening-earth.html :
- Not quite. The original Nature article gives a specific and quantitative definition of what "greening" means in this case. Did you read it? Shock Brigade Harvester Boris (talk) 20:30, 4 February 2018 (UTC)
- Greener means positive impact on plant growth. As far as edit war, it takes two to tango. Daniel.Cardenas (talk) 20:18, 4 February 2018 (UTC)
- I agree. I don't dispute the general idea, but as I said in my original removal of the first time it was added, not clear what "greener" means, and poor intro for this section anyway". To expand upon that second detail, it's not the main topic of the §Impact on plant growth section. DMacks (talk) 19:54, 4 February 2018 (UTC)
- I split the section in two to hopefully address the jarring issue. Thanks for pointing out that the info is from Nature and not NASA. Daniel.Cardenas (talk) 20:26, 4 February 2018 (UTC)
- I've got a few things to take care of right now but will edit this later to make it all flow. That whole section is kind of a mess anyway. Thanks for pointing us to this interesting result. Shock Brigade Harvester Boris (talk) 20:46, 4 February 2018 (UTC)
ppm versus ppmv
The article uses mostly ppm for CO2, but occasionally ppmv (by volume). My understanding is that the consensus is to always express CO2 in the Earth's atmosphere by volume. If this is confirmed, it could be explitly stated, and the inconsistent use correct. --Gregor Hagedorn (talk) 16:41, 23 May 2018 (UTC)
Modeled temperature
Removed the dated graph primarily constructed with a few over a decade old studies. Dated because newer studies based on reconstructions does not seem to be in agreement. The graph appears to be WP:OR, does not come from a study paper. I have nothing against inclusion of modeled temperature, but emphasis should belong on reconstructed data assimilation. A reconstructed figure can be found here, but we need a commons version prokaryotes (talk) 15:37, 28 August 2018 (UTC)
consistent units of mass
This is from the article:
- The daily average concentration of atmospheric CO2 at Mauna Loa Observatory first exceeded 400 ppm on 10 May 2013[12][13] although this concentration had already been reached in the Arctic in June 2012.[14] It currently constitutes about 0.041% by volume of the atmosphere, (equal to 410 ppm) [15][16][4][17][18] which corresponds to approximately 3200 gigatons of CO2, containing approximately 870 gigatons of carbon. Each part per million by volume of CO2 in the atmosphere thus represents approximately 2.13 gigatonnes of carbon.[19]
In one sentence, it uses gigatons. In the next, it uses gigatonnes. I realize a "ton" and a "tonne" of something have almost the same mass. But, the article would be more readable if one were used throughout. SlowJog (talk) 17:51, 13 November 2018 (UTC)
Is one a metric ton and the other a US ton? Long ton possibly? Asking. ( Martin | talk • contribs 06:13, 5 April 2019 (UTC))
- this seems to have been corrected to gigatonnes throughout. See also Tonne#Derived units. EMsmile (talk) 12:45, 8 December 2022 (UTC)
Misleading Graphs
The graphs of CO2 in this article are misleading. Look at the ordinate scales, they are purposely scaled to make it look like the increase in CO2 is geometric. Either remove the graphs or replace them with properly scaled ones. There are lies, damned lies and statistics! 2001:1970:5324:D600:7DF5:A752:7871:B57F (talk) 11:37, 19 May 2019 (UTC)
- The graphs are fine. Which one in particular do you have a problem with? EMsmile (talk) 12:46, 8 December 2022 (UTC)
Inacurate Figures
The figures etc in 'Current Concentration' clearly don't add up or make sense despite have many references they contradict themselves and clearly need sorting. 400ppm first exeeded in 2013....then lower down it was at 410 ppm in 2010, and its increasing by an increasing annual amount of about 2ppm / yr and yet in 2019 its at 413ppm What's actually correct? — Preceding unsigned comment added by Anderoo165 (talk • contribs) 00:31, 5 July 2019 (UTC)
- I am planning to update and improve this section soon. I'll pay attention to this. EMsmile (talk) 12:47, 8 December 2022 (UTC)
Pre-industrial concentrations do not appear in cited text
Under measuring ancient-Earth concentrations it says "260-280ppmv pre-industrial levels". The citation only gives levels back until 1832 and no levels below 280ppmv are given. I found another page by the same authors and it gives a higher range --- "Preindustrial CO2 mixing ratios were in the range 275-284 ppm, with the lower levels during 1550-1800 A.D., probably as a result of colder global climate (Etheridge et al. 1996)." https://cdiac.ess-dive.lbl.gov/trends/co2/lawdome.html 2A00:23C4:859E:1C01:E517:49C:A2A:DB6D (talk) 14:29, 19 September 2019 (UTC)
Table of CO2 emissions
Hedgehoque. You have added data up to 2019 but I can only see figures up to 2018 in the Excel file in your source. Figures for 2019 would not yet be available in sources published before the end of the year.. In addition it does not appear valid to add total fossil fuel usage to changes in land use. Dudley Miles (talk) 22:31, 26 January 2020 (UTC)
- Dudley Miles. For 2019, please take a look at the second source Carbon Budget 2019 by ESSD section 3.4.1. The emissions were projected from the data available in November. I will insert a remark on that. Here you can also find both values added up at the end of the section. The total emission value is used very commonly. Hedgehoque (talk) 00:46, 27 January 2020 (UTC)
- Hedgehoque. OK. I have amended the reference to make it easier to find. Dudley Miles (talk) 10:22, 27 January 2020 (UTC)
Some suggested improvements
Hello to anyone watching this page. :-) I think the image in the lead should be changed. It looks overly complex and is dated 2011, so ten years old. Also, I would suggest to shorten some of the headings. For starters, we could consistently write CO2 instead of carbon dioxide (or vice versa) and probably don't need to repeat the article title in the headings. EMsmile (talk) 01:32, 9 March 2021 (UTC)
CO2 cycling at 5 cycles per year with slight phase shifts.
The NOAA Global Surface CO2 chart shows a distinct and regular oscillation of 1/5th year.
What could be causing this?
I've done a perfunctory search on the internet and turned up this: [1]
But it doesn't suggest or explain this very regular oscillation...or the peculiar period of 1/5th year...or the peculiar slight phase shift year to year forward and back.
This from NOAA's Global Monitoring Page shows a single oscillation per year. [2]
The first thing I question on any article is the source and veracity of the data. It's from there conclusions are made. Bad data...bad conclusions.
WithGLEE (talk) 13:31, 21 October 2021 (UTC)
- The annual cycle is well documented and explained in the article. The 1/5 of a year is new to me though: where did you get it from? If you've just done a Fourier analysis, it'll be harmonics, since the annual cycle isn't a nice sine William M. Connolley (talk) 13:54, 21 October 2021 (UTC)