
Talk:Gini coefficient/Archive 2
| This page is an archive of past discussions. Do not edit the contents of this page. If you wish to start a new discussion or revive an old one, please do so on the current talk page. |
Free Market Nations
In the first paragraph, the article mentions "free market" nations. As far as I'm aware there are no nations that adhere to the free market. There are some that are more liberalised than others (countries such as Singapore and Hong Kong being the most liberalised). The reference should be changed.
04:36, 11 April 2013 (UTC)
Paper Title
In the first paragraph, the paper title is given as "'Variability and Mutability' (Italian: Variabilità e mutabilità)" — unless the paper was written originally in English, shouldn't the title be given as '"Variabilità e Mutabilità' (English: Variability and Mutability)'?
-- 66.233.186.46 (talk) 18:08, 8 June 2013 (UTC)
Bad Color Map in Diagram
The color map goes from yellow to green, back to yellow, back to green. This makes it needlessly difficult to differentiate the low index nations. http://upload.wikimedia.org/wikipedia/commons/3/34/Gini_Coefficient_World_CIA_Report_2009.png —Preceding unsigned comment added by 87.198.170.2 (talk) 13:53, 19 October 2009 (UTC)
04:36, 11 April 2013 (UTC)
Horrible choice of world GINI colourmap - please change!
The current colourmap of the world GINI distribution (18 January 2013) is a terrible choice. This map is completely perceptually non-linear. Even the much-maligned rainbow colour map is better than the one currently in use. PLEASE please please change it asap. Colouring of ordered intensity values is a well-researched topic in visualization, with many good monochromatic or colour scales to choose from. Feel free to check some relevant literature on this matter:
- Why Should Engineers and Scientists Be Worried About Color? (IBM Research)
- Rainbow Color Map (Still) Considered Harmful
- A Quick Visual Method for Evaluating Perceptual Color Maps - IEEE Computer Society, 2001, 183-190
FMalan (talk) 10:33, 18 January 2013 (UTC)
Cuba
I'm not sure why but it seems like Cuba isn't included on quite a few of these maps and lists. I think it's because some data sets ignore them. Maybe it's an ongoing effect of the economic embargo but ... that aside, after a brief google search I found one that has data on them; PDF
04:36, 11 April 2013 (UTC)
Gini indexes – before and after taxes between 1980 and 2010
The four plot presentation is very misleading in stating "most countries" when the four countries selected obviously are chosen to have very similar gini coefs. And of course presenting the after tax gini paints an even prettier picture for all of the four. So this fits nicely with a political agenda dedicated to preserving the status quo of an ever-increasing wealth divide in the USA. Just hide it behind something pretty. — Preceding unsigned comment added by 166.137.210.27 (talk) 23:34, 9 November 2013 (UTC)
World income Gini index since 1800s
Not sure if I've done the right thing here, but I've deleted the "population adjusted" gini figures which I think were sourced from this article: http://www.conferenceboard.ca/hcp/hot-topics/worldinequality.aspx#ftn13-ref. The figures reference a 2005 book by Milanovic, which seem to completely contradict the figures referenced to his 2009 paper in [1], and their explanation of the methodology seems just wrong (population weighted comparison of whole countries). The 2009 paper is [2], I will add it to the article. Dilaudid (talk) 13:46, 11 November 2013 (UTC)
South Africa
The article states that the Gini coeffient for South Africa is 0.7 in the introduction. A dead link is cited, as well as a link to document that actually says "The high income inequality countries in Africa (Gini coefficients in parentheses) include South Africa (58.4%)..", later this page says "while South Africa had the highest income Gini index score of 67.8", further down " South Africa had the world's highest Gini index at 0.62". So I think this needs to be fixed! MartinMorrison (talk) 13:19, 18 January 2014 (UTC)
Gini for lognormal
is probably wrong — Preceding unsigned comment added by 89.67.144.78 (talk) 18:53, 5 May 2014 (UTC)
Gini coefficient of 0.x means what exactly?
This article would benefit from explaining what a coefficient of 0.x means. It's easy to explain 0 (perfect equality) and 1 (perfect inequality). How about 0.6? We say "The Gini index for the entire world has been estimated by various parties to be between 0.61 and 0.68". It would be nice to continue and say "which means that x % of the population earns y % of income". --Piotr Konieczny aka Prokonsul Piotrus| reply here 09:17, 29 April 2014 (UTC)
- Yes, it would be useful but is, unfortunately, not possible. As explained under limitations, the same Gini index can be a result of vastly different income distribution patterns. As a result, only 0 and 1 are easily summarized, whereas all other values can only be understood in terms of other values (i.e., higher Gini = more inequality). Perhaps a comparison can give some perspective in your example: "The Gini index for the entire world has been estimated by various parties to be between 0.61 and 0.68, roughly equal to that of Sierra Leone".No longer a penguin (talk) 12:34, 29 April 2014 (UTC)
- @No longer a penguin: While this is not what I was hoping for, it is still quite useful. Could you provide a ref for such analysis (that Gini between 1 and 0 and hard to interpret)? --Piotr Konieczny aka Prokonsul Piotrus| reply here 07:41, 6 May 2014 (UTC)
- I'm afraid that it's a bit of OR, based on the examples in the article (and sourced to Table 6 http://www.fao.org/docs/up/easypol/329/gini_index_040EN.pdf), It's difficult to source the absence of easy interpretation.No longer a penguin (talk) 15:28, 8 May 2014 (UTC)
- I doubt many readers have sufficient knowledge of Sierra Leone to make that useful. Is there a better known country in the range?--S Philbrick(Talk) 15:13, 14 May 2014 (UTC)
- South Africa seems to be around the same level and is better known.No longer a penguin (talk) 07:28, 15 May 2014 (UTC)
- @No longer a penguin: While this is not what I was hoping for, it is still quite useful. Could you provide a ref for such analysis (that Gini between 1 and 0 and hard to interpret)? --Piotr Konieczny aka Prokonsul Piotrus| reply here 07:41, 6 May 2014 (UTC)
Gini in Template:infobox country
At present the Gini is a parameter in the {{infobox country}} template. The template example given uses CIA Worldbook Gini data. With this background in mind, can editors tell us which of the dozen+ Gini variants are being described in this article and which are the most accepted. (IOW, this article needs some clarity as to what variants are what.) With this information I hope that the infobox parameter can be better defined, and so I'm posting the inquiry here as a starting point. – S. Rich (talk) 23:27, 5 May 2014 (UTC)
To expand on my question, I see both terms (coefficient and index) used in the article. It looks like they are synonyms, but are they? If they are, the article should stick to one usage. If not, then an explanation is needed. (I think "index" is most often used in the references.) Also, we need a listing of the variations. I see the following: a "population Gini coefficient ('GC')", a "pre-tax income inequality GC", an "income GC", an "opportunity GC", and an "income inequality GC". Then we have a "pre-tax income Gini index ('GI')", an "after-tax GI", a "net income GI", an "income GI" (without the net or tax descriptives), an "education GI", an "education inequity GI", an "opportunity inequality GI", a "wealth GI", a "global GI", and an "individual income-based GI". (These are all derived from the article text.) Are these the variations or what? Thanks. – S. Rich (talk) 04:16, 6 May 2014 (UTC)
- Gini "index" and "coefficient" are the same thing. From what I've seen the sources are all over the place, regarding which ones are used (including the CIA WFB, World Bank, Eurostat, and potentially the OECD), the methodologies, and the results. Even the WFB and WB sources are all over the place in terms of latest year for each country, and it's unclear if even such individual sources are using a consistent methodology across national borders or relying on surveys from those nations. If it's the latter then figures aren't even necessarily comparable within the same source. Presumably the Eurostat source uses a consistent methodology, but that doesn't provide global coverage. There doesn't appear to be an outfit that publishes regularly updated Gini figures for the world or even a large chunk of it, much less one with a standardized methodology.
- For that reason we should consider whether this index is appropriate for country article info boxes at all. Contrast it with something like GDP, where outfits like the IMF and World Bank publish new global figures each year. While they differ slightly the two sources' results are pretty close to each other and roughly comparable, so it doesn't even make a huge difference if different articles use different sources. But Gini results can change dramatically depending on methodology, as this pre benefit/post benefit OECD report shows. The template currently labels Gini "optional", but it seems to be included in about every country article, misleading readers into thinking they're seeing something internationally comparable. For example, the US page currently uses the US Census number, which is pre tax/benefit, while numerous European articles use Eurostat, which is post tax/benefit. Unless we can agree on a precise version and find a sufficient source, there isn't much value to giving these figures the prominence of info box status and doing so is arguably detrimental. In that event we should delete it from the template and/or start deleting it from country articles. VictorD7 (talk) 05:55, 7 May 2014 (UTC)
- Those are good points.
- Although gini coefficients are important, I would oppose widespread use in infoboxes until we have numbers that are consistent between pages. bobrayner (talk) 15:48, 8 May 2014 (UTC)
- Thanks. This section seeks to prompt improvements to the Gini article and to help frame a discussion on the infobox template talk page. Can this article be improved to describe how the Gini is used by the IMF, CIA WFB, World Bank, Eurostat, etc.? Doing so will help lead to better infobox usage. – S. Rich (talk) 15:54, 8 May 2014 (UTC)
The Gini coefficient varies between 0, which reflects complete equality and 1, which indicates complete inequality (one person has all the income or consumption, all others have none). Graphically, the Gini coefficient can be easily represented by the area between the Lorenz curve and the line of equality. The Gini Index is simply the coefficient expressed as a percentage (coefficient X 100), where zero represents perfect equality and 100, perfect inequality (see this The Index seems to be more widely used today, likely because most people have trouble understanding something expressed as a coefficient. Meclee (talk) 16:36, 8 May 2014 (UTC)
- Following up on this, there is only one Gini coefficient. Different sources may report different numbers, but that's because of measurement and collection issues. Also, there is pre-tax and post-tax Gini. This however, is not a reason to leave out reporting of the Gini coefficient. For example, country GDP will be reported differently by different sources, and there is real vs nominal GDP, GDP per capita vs GDP per household, PPP adjusted, etc. But we report GDP, we just have to try to be consistent. LK (talk) 05:18, 20 May 2014 (UTC)
- I'm still confused. If there is only one Gini, why are there so many different versions, like the 15 I mentioned above? I not asking to leave out reporting the Gini, but can't the community decide which one is best for usage in articles? The issue need not be resolved here, but a basic understanding and agreement will be helpful for infobox and other usage. Thanks. – S. Rich (talk) 05:37, 20 May 2014 (UTC)
- User:Srich32977: Each Gini Index measures the same thing: how much the distribution of income varies from the poorest to the wealthiest members of a society (and everyone in between).
- I'm still confused. If there is only one Gini, why are there so many different versions, like the 15 I mentioned above? I not asking to leave out reporting the Gini, but can't the community decide which one is best for usage in articles? The issue need not be resolved here, but a basic understanding and agreement will be helpful for infobox and other usage. Thanks. – S. Rich (talk) 05:37, 20 May 2014 (UTC)
- How "income" is calculated, however, varies. Some economists argue that Purchasing Power Parity, for example (which is basically how much a certain amount of money will allow you to buy in a given country -- though it is important not to conflate this with inflation -- a dollar would have a higher purchasing power parity in Somalia than the United States), should taken into account. Others argue that age needs to be taken into account in calculating the index (since a country with a relatively old populace will have more retirees who have no income). But the basic aim is uniform. Steeletrap (talk) 20:08, 22 May 2014 (UTC)
- The situation with GDP is very similar. GDP is what we usually use to measure living standards, but there are different conceptualizations of exactly what to use. There is PPP vs non-PPP adjusted GDP, and GDP per capita vs household GDP, there are other more obscure inconsistencies. We don't resolve the problem by not reporting GDP. Instead, we pick the most commonly used definition(s) from the most reliable sources, and report what they say. On pages about GDP, we also report the methodologies that the reporting organizations use. LK (talk) 07:25, 28 May 2014 (UTC)
- My question (and problem) remains: Which is the most commonly used definition and which is the most reliable source? If different commonly used definitions from different reliable sources are put into templates for different articles, what good is the template or Gini? That is, an infobox template used for one country's article might have different definitions & sources compared to another country's infobox. (Hence, the presentation of different Gini indexes in different articles is subject to misuse.) Is it fair to say that the different conceptualizations make it impossible to use one standard conceptualization in all templates/infoboxes? If so, please say so. I'd like to get clarification so that infobox clarification can be achieved. – S. Rich (talk) 19:00, 28 May 2014 (UTC)
- Yeah, it's worth repeating that just because something may be article worthy doesn't make it info box worthy. Gini is different than GDP for reasons laid out above involving standardization of methodology (mostly just two GDP types, with one emphasized for international comparisons) and regular publishing of global scope. VictorD7 (talk) 08:52, 30 May 2014 (UTC)
Why does list of countries by gini index link to list by HDI?
Main article for 'List of Countries by Gini Index' is 'List of countries by Human Development Index' currently. I see no reason for this to be listed as such, although admittedly I am not an expert on this subject. — Preceding unsigned comment added by 140.103.38.137 (talk) 00:47, 31 January 2015 (UTC)
- I agree, there is no rational reason. GINI and development are two different things. Limit-theorem (talk) 06:53, 31 January 2015 (UTC)
- I corrected. Thanks for the heads up.Limit-theorem (talk) 06:56, 31 January 2015 (UTC)
Known Distribution function
I added the table giving the Gini coefficient for some particular probability density functions, but I did not remove the first table, which is not very clear. The functions in the left column of that table are not distribution functions. The text is unclear as to what they represent. I tried to fix it, but it was reverted. It's not good the way it is. Any suggestions? PAR (talk) 03:17, 30 April 2015 (UTC)
External links modified
Hello fellow Wikipedians,
I have just added archive links to one external link on Gini coefficient. Please take a moment to review my edit. If necessary, add {{cbignore}} after the link to keep me from modifying it. Alternatively, you can add {{nobots|deny=InternetArchiveBot}} to keep me off the page altogether. I made the following changes:
- Added archive https://web.archive.org/20141109193609/http://stats.oecd.org:80/Index.aspx?QueryId=26068 to http://stats.oecd.org/Index.aspx?QueryId=26068
When you have finished reviewing my changes, please set the checked parameter below to true to let others know.
This message was posted before February 2018. After February 2018, "External links modified" talk page sections are no longer generated or monitored by InternetArchiveBot. No special action is required regarding these talk page notices, other than regular verification using the archive tool instructions below. Editors have permission to delete these "External links modified" talk page sections if they want to de-clutter talk pages, but see the RfC before doing mass systematic removals. This message is updated dynamically through the template {{source check}} (last update: 18 January 2022).
- If you have discovered URLs which were erroneously considered dead by the bot, you can report them with this tool.
- If you found an error with any archives or the URLs themselves, you can fix them with this tool.
Cheers. —cyberbot IITalk to my owner:Online 06:38, 26 August 2015 (UTC)
Gini index not the same as the Gini coefficient?
I'm currently reading "Machine Learning" by Peter Flach and I came across the footnote:
"When I looked up 'Gini index' on Wikipedia I was referred to a page describing the Gini coefficient, which - in a machine learning context - is a linear rescaling of the AUC to the interval [-1,1]. This is quite a different concept, and the only thing that the Gini index and the Gini coefficient have in common is that they were both proposed by the Italian statistician Corrado Gini, so it is good to be aware of potential confusion."
131.252.200.140 (talk) 21:31, 24 October 2015 (UTC)
Map Bias
Why is the world Gini Coefficient colored the way it is? It implies that countries with more income equality are better than those with less. 71.90.19.84 (talk) 21:06, 31 October 2015 (UTC)
- LOL - Why are filthy-rich blue-blood republican states colored red, while red-flag waving commie liberal states colored blue? Any color choice you make will carry emotional/political baggage. If you are in scientist mode, travel light. PAR (talk) 00:36, 1 November 2015 (UTC)
Known distribution function
How can it be that the uniform distribution and the delta distribution produce the same index? Indeed how can it be that the explanation for the delta distributions says:
The Dirac delta function represents the case where everyone has the same wealth (or income)
If the argument of the delta is the fraction of the population then the explanation is incorrect. If the argument of the delta is the income, then the explanation is correct. So it seems that the relation between the tables is an exchange of the axis. What ever it is, it would be good that some expert revise these tables and explain what is each of them properly. Kakila (talk) 21:55, 28 October 2015 (UTC)
- Good catch. I would ignore: The delta function assumes all the distribution concentrates at one point. Assume that point is at the upper end, meaning that while the integral of the density is 1, the excess over that exact point is 0. This gives an index of 0 but it is absurd, both practically and mathematically.Limit-theorem (talk) 22:48, 28 October 2015 (UTC)
- In the table, the Dirac distribution and the uniform distribution are not equal, so I don’t understand that problem.
- I agree that the explanation of how a probability distribution can be used to represent an income distribution is rather vague. I have tried to fix this in this article and the Lorenz curve article.
- I also agree that if the probability distribution is a Dirac delta, deriving the Lorenz curve is problematic. However, it states in the Lorenz curve article:
The inverse x(F) may not exist because the cumulative distribution function has intervals of constant values. However, the previous formula can still apply by generalizing the definition of x(F):
- x(F1) = inf {y : F(y) ≥ F1}
- I have not verified that this “fixes” the problem with the Dirac delta, but I do know that for a number of probability functions f(x,a) (e.g. normal distribution, Chi-square distribution) which tend to a Dirac delta for extreme values of a, the Lorenz curve tends to the expected straight line L(F)=F. In other words, I expect that, given the above generalization of x(F), the statement that the Dirac distribution yields a Gini Coefficient of zero is not absurd. PAR (talk) 00:25, 1 November 2015 (UTC)
- I removed the Dirac Delta. Too confusing and not applicable for wealth since it concentrates on a point; given that we have natural numbers it cannot apply in a measurement. Limit-theorem (talk) 07:17, 1 November 2015 (UTC)
- I don't think it should be removed. Understanding the delta function will remove the confusion, deleting references to it will remove good information. Yes, with real populations, we deal with discrete, natural numbers, but dealing with real numbers is a good approximation when the natural numbers are huge. If we limit ourselves to natural numbers, then we need to wipe out every reference and definition in the article which uses real numbers and functions of real numbers. Not a good idea. So once we accept the continuum approximation involving real numbers, we have continuous probability distributions of income or whatever. Many of these distributions will tend to a Dirac delta function for extreme values of some parameter, so its reasonable to ask what happens to the Gini coefficient when this happens. and the answer is not ambiguous or confusing. The bottom line is that if we are dealing with huge numbers of people and their incomes (for example), the Dirac delta function is a continuous approximation to everybody having nothing except for one person having everything. An unlikely, but "measurable" situation. The resulting Gini coefficient is a good approximation to the discrete Gini coefficient that we would then calculate.. PAR (talk) 09:50, 18 November 2015 (UTC)
Formula in the definition
The formula for the Gini coefficient reported in the "definition" section is a little confusing.
As of now it reads:

But it's strange to have the double summation in the denominator because:
- only the i index appears on the x in the denominator
- the 2 in the denominator should already take care of the double summation of absolute differences that it's done in the numerator. Having 2 times twice this sum may suggest that you to sum *4* rather than 2 times all frequencies x.
This seems more accurate instead: — Preceding unsigned comment added by Brucap (talk • contribs) 10:35, 9 December 2015 (UTC)

- It's correct as it stands. The second summation in the denominator evaluates to a factor n (not 2). Compare to the definitions in mean absolute difference.

I see: now it's clear. But then I would actually write instead that the double summation: it's more transparent. — Preceding unsigned comment added by 130.60.140.212 (talk) 16:11, 10 December 2015 (UTC)

Income distribution function
Above the table, the (income) probability distribution is defined as:
- the function f(x) where f(x)dx is the fraction of the population with income between x and x + dx.
In case of total equality, everyone has the same income x0, so for every value of x ≠ x0, one has f(x) = 0. However the integral of f(x) over all x must be 1. This together makes f(x) a dirac function centered on x0.
A homeogeneous distribution between a and b means that the chance of having an income of any value between a and b is equal. So the same number of people have income a as are having income b. As long as a ≠ b that is not total equality.
−Woodstone (talk) 16:22, 26 January 2016 (UTC)
- I kept the Dirac as is but one needs to be extra careful with Dirac because it concentrates on one point (which necessary implies continuous distribution) and excludes mass elsewhere. It is what we call a degenerate case implying no probability distribution.Limit-theorem (talk) 16:41, 26 January 2016 (UTC)
- The statement "The Dirac delta distribution represents the case where everyone has the same wealth (or income) but it implies that there are no variations at all between incomes." repeats itself.
- Fixed. The deeper problem is that the Dirac Delta is not a probability distribution, hence the Gini cannot be technically computed. I have removed all references to Dirac Delta before and it keeps being put in. We should decide.Limit-theorem (talk) 22:53, 26 January 2016 (UTC)
- Yes, I keep putting them back in because there is no problem. Yes, the Dirac delta is a distribution, not a function, but that does not mean it is useless. Technically, the Gini *can* be computed. Take for example the uniform distribution
- for and zero otherwise.


- The Gini coefficient is

- Clearly,

- where δ(.) is the Dirac delta function and even more clearly:

- THIS IS ALWAYS THE CASE. Whenever the probability distribution f(x,p) (where p is a bunch of parameters) approaches the Dirac delta function as the parameters approach some critical value or values, the Gini coefficient will approach zero. No problem, no puzzle, and technically computable. With an understanding of the meaning of the delta function, it stands as a valid probability distribution, yielding Gini coefficient zero. PAR (talk) 01:58, 27 January 2016 (UTC)
- Here is a proof using the delta function alone, it's easier than I thought. For the continuous case, the Gini coefficient is:

- where f(.) is the probability density function (PDF) and F(.) is its cumulative distribution function (CDF). Let's take the case where the PDF is a delta function: δ(x-m) where m is not zero. The CDF is H(x-m) where H(.) is the Heaviside step function. It's easily found that:

- and

- I think the derivation is right, but you need a reference as Wikipedia is not original research. My reservation comes from the fact that Delta is not a probability distribution hence many other requirements fail. Perhaps mention that "in the degenerate case, we get...". Also you can more rigorously get your result if you took the limit of a Bernoulli with p approaching 1, rather than just start with the limiting case and integrating. Limit-theorem (talk) 09:58, 28 January 2016 (UTC)
- I fail to see why the Dirac delta is not a probability distribution. It exactly describes the case where only one value (of income) is realised, in other words where there is no variation (in income) at all. Yes, strictly only applies to infinite population, but is the limit for the case that everyone has the same income. −Woodstone (talk) 11:55, 28 January 2016 (UTC)
- Yes. Its integral is one and its everywhere non negative (in the sense of a measure), and that's all it needs to be a probability density. It has all its moments (unlike some), it has a mean and variance and entropy, a cumulative distribution function and a characteristic function. Its listed in the "probability distribution" template, etc. With regard to the limit of a Bernoulli, that's a good point, its also the limit of many discrete distributions. For example, its the limit of the Binomial distribution as n->infinity and x=1/N.
- I spent some time thinking about that "proof", and I didn't mean to be a dick about it, I wanted to explain it to myself as well. I don't think it rises to the level of "research" though. Nevertheless, I will try to find a reference. PAR (talk) 14:47, 28 January 2016 (UTC)
- Thanks. Incidentally you can get the result by taking the limit of the Normal Distribution with standard deviation at 0. But the Normal is not appropriate for Gini because it is on the real line, you need a distribution with positive support. Limit-theorem (talk) 00:35, 29 January 2016 (UTC)
- I spent some time thinking about that "proof", and I didn't mean to be a dick about it, I wanted to explain it to myself as well. I don't think it rises to the level of "research" though. Nevertheless, I will try to find a reference. PAR (talk) 14:47, 28 January 2016 (UTC)
- Half normal distribution would be good, then, and I think it goes to a delta for σ->0. I think it would be good to add it at some point. PAR (talk) 01:23, 29 January 2016 (UTC)
- Actually Lognormal so you get the same result. I will add lornormal later as it is a common income distribution assumption.Limit-theorem (talk) 06:24, 29 January 2016 (UTC)
- Half normal distribution would be good, then, and I think it goes to a delta for σ->0. I think it would be good to add it at some point. PAR (talk) 01:23, 29 January 2016 (UTC)

The above derivation for m=0 is incorrect because changing scale changes the limits of integration. For the distribution δ(x-xo), the Gini coefficient is indeterminate for xo=0. E.g., for the uniform distribution, if a=0, Gini=1/3, no matter what the value of b. For other distributions, as they approach δ(x), the Gini coefficient may be different. PAR (talk) 05:07, 17 March 2016 (UTC)
- I would not worry about this marginal case xo=0, since it represents the situation where no one has any income at all. No wonder calculations of its distribution run into problems. Just like we exclude the case of negative income, we should also exclude the case of total zero income. −Woodstone (talk) 06:59, 18 March 2016 (UTC)
- I'm not sure this is the case. I added the Weibull distribution to the table of probability distributions because it has such a simple Gini coefficient: G = 1 - 2 -1/k. As k approaches zero, the distribution becomes a delta function at zero, and the Gini coefficient becomes one. So it does not correspond to everyone having zero income, but rather to almost everyone having zero income, which is not the same. On the other hand, if you take the uniform distribution p(x,b)=1/b between zero and b, zero everywhere else, in the limit as b goes to zero, it becomes a delta function at zero, but the Gini coefficient is always 1/3, no matter the value of b. The value of the Gini coefficient for δ(x) must be indeterminate and the idea that it represents everyone having zero income is not necessarily true, even though δ(x-xo) for xo>0 does represent everyone having the same income (xo). PAR (talk) 23:05, 18 March 2016 (UTC)
Where does the table belong?
I moved the table of Gini coefficients for a continuous probability distribution to the section describing continuous probability distributions. It seems like the right place, and I was wondering why it was reverted. PAR (talk) 20:52, 24 March 2016 (UTC)
Reorganization
I've reorganized things into a number of new sections. Previously continuous and discrete were all mixed up, random special cases were mixed with alternate expressions of the general case. Nothing has been removed except the table under "known distribution function" which was not good, it did not clearly define the distribution function, and all of its particular cases can be found under the "continuous probability distribution". If any one thinks this table was helpful, please restore it under "continuous probability distribution", but I cannot make much sense of it.
The "known distribution function" and "general case" sections have been removed. Repetitions were removed, otherwise the contents were redistributed to the appropriate section. PAR (talk) 04:27, 31 March 2016 (UTC)
Gini index vs. coefficients
The article confuses Gini index values and Gini coefficient values throughout. Gini coefficients are not whole numbers; the values range between 0 and 1. Coefficients are express as fractional numbers, usually decimal numbers between 0 and 1. In this case, a coefficient of 0 = a perfectly equal distribution of income (wealth, or other factor) while 1 means a perfectly unequal distribution where all income (wealth, or other factor) is held at the very top of the distribution. Gini Index values are whole number expressions derived from normalized Gini coefficients. Gini Index values run between 1 and 100; where, in this case, 1 is a perfectly equal distribution and 100 is perfect unequal distribution. I've caught several mistakes of this type in the article, but advise others to be on the lookout for other errors of the same type where coefficient values and index values have been confused. Regards, Meclee (talk) 01:01, 30 May 2016 (UTC)
- The statement above is mistaken. Coefficients need not be between 0 and 1 and indexes are not necessarily whole numbers. There is not really a confusion or opposition between Gini index and coefficient. The Gini coefficient is computed as a real number between 0 and 1, but can also be expressed as a percentage. A percentage is a real number to be divided by 100 to get the actual value. It is not unusual to omit the percent sign (the explicit indication of division by 100) if context makes the meaning clear. Since Gini coefficients of less than 1% practically do not occur, there is never any confusion. −Woodstone (talk) 08:56, 30 May 2016 (UTC)
Wrong formula in the "Definition" section
The first formula in the definition section, the one for the discrete case with equal weights for every member of the population, has a double summation in the denominator. Since there is no "i" index in the term that's being summed over, the outer summation should just evaluate to n. However, in that case it is easy to verify that the maximally unequal distribution (where one person has all the income and all the others have nothing) would yield a value of 1/n, not 1 as it should. Therefore, the summation over i in the denominator is wrong and should be edited out so that only the summation over j remains. This would also make the formula consistent with the ones in the "Calculation" section. Any disagreements? 2A02:908:EB44:C260:DDA:AC62:98F8:BF8C (talk) 15:20, 29 August 2016 (UTC)
- In the given case it evaluates to 1-1/n, which converges to 1 for growing n. See also explanation in the archive. −Woodstone (talk) 15:58, 29 August 2016 (UTC)
- It is also consistent with the definition using the Lorenz curve. The curve stays at 0 until (n-1)/n = 1-1/n and then rises to 1. Area under it is 1/2n. Gini = 1-2(1/2n) = 1-1/n. −Woodstone (talk) 16:39, 29 August 2016 (UTC)
- You are right, I made a mistake. But still the sum over i in the denominator is useless since the x_j are constant in i, so the whole denominator just evaluates to 2n * [sum over j] x_j, so why not just write that instead? 2A02:908:EB44:C260:46:D10B:F359:50BD (talk) 20:08, 7 September 2016 (UTC)
Countries by Gini Index
Main article: List of countries by income equality
A Gini coefficient above 50 is considered high; countries like Chile, USA, Russia, China, Bolivia, Mexico and Central America countries can be found in this category. A Gini coefficient of 30 or above is considered medium; countries like USA and Venezuela can be found in this category. A Gini coefficient lower than 30 is considered low; countries like Austria and Denmark can be found in this category.[55]
30 and above should be changed to 30 to 50. Then USA should be only in high gini index list.
Also, map coloring is not correct, India colored in green but it should be medium, therefore light red. Ganegaar (talk) 13:47, 20 December 2016 (UTC)
Citation Needed formatting?
Hello, I was planning to put on a citation needed tag. It ended up just showing the raw text. Came in and added a space, but still it showed the raw text. Any help formatting the citation needed? Thanks, Cocohead781 (talk) 01:14, 20 September 2017 (UTC)
- @Cocohead781: Fixed. The visual editor had marked most of the template as literal text, possibly thrown off by the quote marks in the Reason field. Nitpicking polish (talk) 14:15, 20 September 2017 (UTC)
External links modified
Hello fellow Wikipedians,
I have just modified one external link on Gini coefficient. Please take a moment to review my edit. If you have any questions, or need the bot to ignore the links, or the page altogether, please visit this simple FaQ for additional information. I made the following changes:
- Added archive https://web.archive.org/web/20081201193249/http://www.eurofound.europa.eu/areas/qualityoflife/eurlife/index.php?template=3&radioindic=158&idDomain=3 to http://www.eurofound.europa.eu/areas/qualityoflife/eurlife/index.php?template=3&radioindic=158&idDomain=3
When you have finished reviewing my changes, you may follow the instructions on the template below to fix any issues with the URLs.
This message was posted before February 2018. After February 2018, "External links modified" talk page sections are no longer generated or monitored by InternetArchiveBot. No special action is required regarding these talk page notices, other than regular verification using the archive tool instructions below. Editors have permission to delete these "External links modified" talk page sections if they want to de-clutter talk pages, but see the RfC before doing mass systematic removals. This message is updated dynamically through the template {{source check}} (last update: 18 January 2022).
- If you have discovered URLs which were erroneously considered dead by the bot, you can report them with this tool.
- If you found an error with any archives or the URLs themselves, you can fix them with this tool.
Cheers.—InternetArchiveBot (Report bug) 15:55, 17 October 2017 (UTC)
Limitations not convincing
Many of the arguments under the "limitations" section boil down to: the Gini measures inequality, not poverty (e.g. "for example, while both Bangladesh (per capita income of $1,693) and the Netherlands (per capita income of $42,183) had an income Gini index of 0.31 in 2010,[54] the quality of life, economic opportunity and absolute income in these countries are very different"; also the "Gini coefficient falls yet the poor get poorer, Gini coefficient rises yet everyone getting richer" section). But of course, it's *meant* to measure inequality, not poverty. I don't think this is a limitation of the measure. Perhaps it's a critique of people misusing the measure, but I'm not sure I've actually seen anyone misusing it in this way. — Preceding unsigned comment added by 129.105.50.134 (talk • contribs) 19:42, 25 July 2014 (UTC)
Inconsistent?
Maybe I am missing something, but as I read the text, the index goes from zero (0) to one (1), yet the two maps have values in the double digits (25 to 66). Values cannot exceed the index. Shouldn't the text be changed to read 0~100 or the maps to 0.25~0.66? Kdammers (talk) 17:25, 30 April 2020 (UTC)
- The Gini index can be expressed as a percentage. So a Gini index of 0.3 is written as 30%. Publications occasionally omit the percent sign in these cases.−Woodstone (talk) 07:21, 1 May 2020 (UTC)
- The picture is probably from an external source and not editable. A Gini coefficient of less than 1% is theoretically possible, but never occurs in reality. So if you see a Gini coefficient displayed as a number over 1, you can safely interpret it as a percentage, and in reverse, a stated G under one can be safely interpreted as not a percentage.−Woodstone (talk) 12:54, 2 May 2020 (UTC)
Some suggested Gini-introduction wording and the Total Inequality subject
I've noticed that the formula for Total Inequality that I posted gives a value of .5 when the Gini = 0. When there's no inequality, then of course the Total Inequality should be zero, and so there must have been some error when I derived that formula. So I've deleted that post.
What remains below is something that I'd like to add to the top of the Gini article, along with a brief graphical explanation of a derivation of the formula for Gini, with repect to B.
I'll wait a month for that, in case there are objections.
Along with the graphical derivation, I'd like to follow it with an algebraic derivation.
If I find out what's wrong with my derivation of the Total Inequality formula that I posted here, I'll correct it and post it.
Here's some wording that I suggest to be placed at the top of the Gini article:
Given the importance of and interest in, for cumulative population up to some percentile, such as the poorest 10%, in a how much of their equal share that %ile group has, then... .
...the Gini is important and of interest as the sum, over all percentiles, of the shortfall (from equal-share of income) of the cumulative population up to each percentile. .
...as a single number that sums that shortfall over all percentiles. . — Preceding unsigned comment added by 71.84.136.105 (talk) 23:34, 16 October 2020 (UTC)
Suggested Additions to Gini Definition and Explanation.
I'd like to add an obvious, natural, intuitive explanation for the motivation for the Gini, an explanation that leads directly, naturally and easily to the graphical definition of the Gini.
Below is a start on a composition of that explanation, with more text and re-arrangement to be added. I'll wait about a month before I add it, in case there might be objection:
The Gini is the sum, over all population-percentiles, of the shortfall, from equal-share, of the cumulative-income up to each percentile. ....with that summed shortfall divided by the greatest value that it could have, with complete inequality (1 person having it all). — Preceding unsigned comment added by 71.84.136.105 (talk) 18:24, 21 October 2020 (UTC)
And, because a household's income's departure from mean, and changes in it, is counted in a lot more cumulative-income totals if the household is at a low percentile, then the Gini weights the departure from mean of a low-percentile household more strongly than that of a high-percentile household.
And, to answer the objection that the Gini overcounts the middle, and that (like all indices that look at all the incomes) the Gini doesn't tell where the departure from the mean occurred, I'd suggest that the difference between the Lorenz curve and the 45 degree line be integrated only up to the mean, or only to the 10th percentile.
For the version integrating to the mean, I'd call it "Gini to Mean", "Robin Hood Gini", or "Social Gini" (because what happens to the poorest is more socially important).
For the version that integrates to the 10th percentile, I'd call it "Gini to .1", or "Social Gini".
Of course, for those indices, the integral would be divided by the highest value that it could have. — Preceding unsigned comment added by 71.84.136.105 (talk) 19:15, 17 October 2020 (UTC)
- The anonymous editor who wrote the above should be aware that WP is not the place to add one's own inventions and proposals. WP describes what is currently used widely in the world supported by reliable sources. −Woodstone (talk) 07:24, 23 October 2020 (UTC)
The article rightly points out that the Gini (like all the inequality indices that look at all incomes and summarize the inequality with one number) doesn't tell anything about what the departure from the mean is over any particular region of population-percentile. . It isn't a new "invention" or original proposal, or original-research, to mention that the abovestated objection is obviously answered if the distance between the Lorenz curve and the 45-degree line is integrated only up to, say, the 10th population-percentile, or to the 40th percentile, or to the population-percentile at which the mean income is had. ...and that summed shortfall is divided by the greatest value that it could have, as is usual with the Gini. .
That's just the application of the already-universally-used inequality-index to a specific segment of the population, instead of applying it over the entire population. ...in order to show something more specific. .
So yes, you're right that i shouldn't name that as if it were a new inequality-index, because of course it isn't one. It's just a use of the already-universal index, as an obvious answer to a common criticism of the Gini as currently used.
When I post, to this talk-page, text that I propose to be added, the integration of the Lorenz curve's shortfall from the equality-line within a lower-percentile region will only be mentioned pursuant to objections and issues raised in Wikipedia articles, including this Gini article.
It won't be presented or offered as a proposal.
I won't add it to the article unless, for a month after I post the proposed text to this talk-page, there's no objection. If there's objection or disagreement, then I'll abide by the Wikipedia procedure for disagreements.
— Preceding unsigned comment added by 71.84.136.105 (talk) 23:11, 23 October 2020 (UTC)
Wording That I Propose To Add, Regarding The Gini's Motivation:
Wording That I Propose To Add, Regarding The Gini's Motivation:
I propose to add the following wording after my brief definition paragraph and before the section with the graphical definition with the Lorenz diagram.
Motivation leading to the Gini:
(Initially, until otherwise stated,for this discussion, the percentile x is a percentile below the percentile at which the meann income occures.)
A sometimes-used inequality-measure is mean income divided by income at the `10th percentile. It could be replaced by its reciprocal, the income at the 10th percentile, or any percentile x, divided by what it would be with equality (the mean income).
That is,
Ix/Iav, where Ix is income at percentile x, and Iav is average income. But, instead...
1 - Ix/Iav
...is used instead, for which some justifiations are given a few lines below.
Multiplying the above expression by the constant Iav (constant in any particular income distributio) gives:
Iav - Ix. ...the shortfall of Ix from what it would be with equality.
Advantages of using Iav - Ix, the shortfall from equality-value, instead of Ix/Iav include the following:
In a sum of differences, if a number in one of the differences is changed, the magnitude of change in the overall sum is equal to the magnitude of the change in the number that was changed in one of the differences. Of course that isn't true if a number in one of the quotients in a sum of quotients is changed.
It results in an index that varies from 0 to 1 as inequality varies from none to maximum.
The shortfall from equal-share is what is used.
Of course, as an inequality-measure, the shortfall from equal-share of income at one percentile has the disadvantage that doesn't look at, count, be affected by, or react to change in, any other incomes, other than that one income.
From that, a first improvement in breadth, a first generalization by averaging, would be the average income shortfall, over the percentile-range from 0 to x. That can also be said as: The shortfall from equal-share of the cumulative income up to x percentile.
But that, too, has a disadvantage, a shortcoming: It doesn't registger or react to even the most drastic changes in the income distribution within that percentile-range from 0 to x.
e.g. For x = .1, the people in the 9th to 10th percentile range could take everything away from all the people in the 0 to 9th percentile range, and the index wouldn't react or change at all.
So, take the averaging-generalization another step: Average, over all percentiles from 0 to x, the cumulative income up to each percentile from 0 to x.
That, explicitly from the wording, registers, counts the shortfall from equal-share of the cumulative income up to each percentile from 0 to x.
If the distribution from percentiles 0 to x changes in a way that increases the inequality within the 0 to x range, the index reacts to that by increasing.
That average, over all percentiles from 0 to x, of the cumulative income up to each percentile from 0 to x, is divided by the greatest value that it could have. ...the value that it woiuld have if there were complete inequality (1 person having all the income).
Of course, when divided by its maximum possible value, the result is the same whether it's the mean or the sum, of those shortfalls of cumulative incomes, that is divided. In practice the sum is used, but the result can correctly be described as the result of dividing the mean by the largest value that it could have.
That's the Gini, evaluated for the percentile range from 0 to x.
It's an average of averages of individual income shortfalls.
Of course, in practice, as currently used, the Gini is evaluated over the whole percentile-range. i.e., from 0 to 1.
For x values up to the percentile at which the mean income occurs, the Gini is motivated and justified as described above.
But it has justification above the mean as well.
It could be argued that we don't care about the shortfall of cumulative incomes that include incomes above the mean. Incomes above the mean aren't being shorted, and their "shortfall from equal-share" is negative.
Yes, but the shortfall below equal-share of cumulative income up to a percentile, x, even if some of those incomes in that range are above the mean, shows the degree to which income is unequally-concentrated among percentiles above x.
So the above-mean part of the Gini isn't without value or meaning, because it counts income-concentration at the top.
Like CV (also called RSD, Relative Standard-Deviation) the Gini is intended to summarize both the equality-shortfall of lower incomes, and the concentration of income at the top. Hence the justification of evaluating the Gini all the way to the top.
...and therefore, like CV, the Gini has the disadvantage of not telling where in the population the departures from the mean occur. It is to be emphasized that the Gini has that shortcoming in common with any and every index that looks at all the incomes and reports a single number.
...and that the Gini has that lack of specificity only because specificity is intentionally traded for an overall single number that counts both the shortfall below the mean and the concentration at the top.
It is to be emphasized, then, that the Gini's lack of specificity is entirely the result a choice of generality instead of specificity. ...the choice to apply it over the entire population for an overall summary, rather than, only for some subset of the population, up to , say, the 10th percentile, the 40th percentile, or the percentile corresponding to the mean income, to report shortfall in that particular region.
The choice of generality over specificity.
Including the Gini, there are several inequality-measures that look at all incomes, and return a single number. The various such inequality-measures differ in how they weight changes in various parts of the income-distribution. That difference in weighting or emphasis of different parts of the income distribution doesn't mean that some measures are right and others are wrong. Choice between them is just a matter of which weighting or emphasis an individual prefers.
The Gini most strongly weights changes in incomes at the low end of the income-distribution. Here's why:
An income at a low percentile is counted in all the cumulative-incomes up to all the percentiles above that income's percentile. e.g. If the poorest person's income is raised by a dollar, that raises the cumulative income to every percentile by dollar. The entire Lorenz curve is raised by the amount by which the lowest income is raised. Changes to incomes at higher percentile change fewer cumulative-incomes.
Because the change to a low-percentile income is applied to more cumulative incomes, the Gini is changed more when a low-percentile income is changed by a given amount.
Therefore, changes in an income are weighted proportionally to the distance of that income's percentile from the 100th percentile.
...making the Gini particularly desirable,among the indices that look at all incomes and return one number, for those who are most interested in comparisons of how the lower-income population-percentiles are treated in an income-distribution.
(But obviously, if one is interested only in comparison of how a particular percentile-region of the population is treated, then that suggests the desirability of an inequality measure that looks specifically only at that percentile-region.)
— Preceding unsigned comment added by 71.84.136.105 (talk) 22:29, 25 October 2020 (UTC)
- Much of the above wording without reference to reliable sources, remains a statement of personal ideas and proposals. Therefore it does not qualify for inclusion in WP. Please read WP:NOR.
−Woodstone (talk) 10:19, 26 October 2020 (UTC)
I've replaced the proposed text-addition with a version from which I've removed or changed the criticizable or challengable parts.
The WP:NOR page clearly states that basic arithmetic isn't original research. I don't say anything in that proposed wording that isn't supported by basic arithmetic. Thus the standard of verifiability is met too, because every statement is verified by basic arithmetic.
But if something that I say in that proposed section lacks verification, or might be untrue, then of course I want to hear *specifically* about it, so that I can either remove or verify it. Was there a particular unverified statement in my proposed section that you were referring to?
I wasn't aware of my proposed text containing a proposal. What proposal?
- The text here is a lot of rambling in incomplete sentences. But a key point seems to be limiting the calculation to a partial sum. Can you point to sources that discuss this way of extending the definition?? −Woodstone (talk) 09:29, 27 October 2020 (UTC)
"The text here is a lot of rambling..."
This use of "rambling" is a vague, referentless angry-noise. There's nothing disordered or rambling in my text. ...but of course I'd welcome constructive suggestions if clarity could be improved.
I started with a familiar, in-use, way to say something about an income-description, one mentioned in Wikipedia's "Inequality-metrics" article.
I mentioned the obvious fact that an obvious limitation of it is remedied by an averaging, resulting in another popular and familiar thing to say about an income-distribution.
Then I pointed out that the resulting measure of cumulative income to x percentile overlooks what happens within that region. ...and that,obviously, that shortcoming is remedied by averaging the cumulative-incomes up to all the percentiles up to x, instead of just to x. ...an obvious repetition of averaging. ...resulting in another familiar measure, the one that's universally used, with 100 percentile as x. The Gini. Having shown a motivation for that measure below the mean, I then told why it also says something relevant above the mean, as the Gini Index as actually used. Rather than rambling, those topics were covered in a useful and meaningful order.
"in incomplete sentences."
You're referring to my use of ellilpsis. I do that for clarity. Long sentences become unclear, just by their length. So I like to write a shorter sentence. ...followed by an ellipsis-deliminted continuation that adds information or clarifies meaning without confusingly jamming onto the short and clear sentence. The use of ellipsis in that manner isn't incorrect.
"But a key point seems to be limiting the calculation to a partial sum."
...when showing a motivation of the Gini, to remedy well-known shortcomings of certain familiar low-percentile income measures by repeated averaging.
...and to answer the unspecificity-criticism by clarifying that it isn't an inherent inevitable attribute of the Gini summation, but rather is only the result of an intentional choice for generality over specificity.
"Can you point to sources that discuss this way of extending the definition??"
My current text doesn't advocate any proposal. The averaging that I speak of is basic arithmetic, and, in fact, is already familiar and popular when it looks at the income-share of the bottom 10%, as opposed to the income at the 10th percentile.
That discussion based on already-familiar-and-popular uses of averaging, basic arithmetic, is much too obvious to need citation of Notable-Sources to verify it.
And basic arithmetic, especially when already in popular use for inequality-measures, isn't Original-Research.
Here's a quote from Wikipedia's "Inequaity-Metrics" article. ...a quote that shows the lack of understanding of the Gini's motivation and meaning:
"The Gini index is the most frequently used inequality index. The reason for its popularity is that it is easy to understand how to compute the Gini index as a ratio of two areas in Lorenz curve diagrams. As a disadvantage, the Gini index only maps a number to the properties of a diagram, but the diagram itself is not based on any model of a distribution process. The "meaning" of the Gini index only can be understood empirically. Additionally the Gini does not capture where in the distribution the inequality occurs. As a result, two very different distributions of income can have the same Gini index. "
The author of that implies that the Gini is without "meaning", and is about nothing but "the properties of a diagram."
The author implies that failure to show "where in the distribdution the inequaliy occurs is a specifically Gini problem (while actually it's an intentional choice for generality over specificity, made when applying the summation to the entire distribution and outputting a single number).
My text addresses those two misconceptions. If the Gini has an obvious motivation and meaning (It does), then the reader has a right to hear about it.
...via a use of basic arithmetic that's already familiarly and popularly in use for measuring inequality.
I've added a few paragraphs to my proposed article-addition, about the weighting of income-changes at different population-percentiles.
I won't add my proposed added-text to the article unless the objection to the addition has been resolved. ...in which case I'll add the text with whatever reasonable changes have been suggested by others. ...in whatever reasonable form has been suggested by others.
After a calendar-month, starting from today, has elapsed, if there hasn't been such a resolution, and if there evidently won't be one, then I guess the matter will go to a vote, or to arbitration based on official Wikipedia rules. It seems to me that, in that circumstance, a vote would be better, at least at first. Hopefully that vote could include any uninvolved and uncommitted visitors, so as to indicate what readers would prefer.
One purpose of that month's delay is to ensure that there's plenty of time for anyone to suggest improvements, especially for clarity, in the proposed added text.
...but also as an opportunity for objections to be expressed, and for me to state my answers to them. — Preceding unsigned comment added by 71.84.136.105 (talk) 19:37, 27 October 2020 (UTC)
Just one more thing here: It occurs to me that maybe a fairly big block of proposed added-text should be posted to the sandbox instead of to this talk-page. I don't know--As I understand it, posts to the sandbox are only there temporarily, so there wouldn't be much time for getting opinions. Anyway, I won't post more until I've written a complete final version of what I suggest.
It will include:
1. The Gini-motivation that I've described
2. Some answers to the objection about lack of information about where, in the distribution, the inequality is. Those answers will include a suggestion from a notable-source; and my clarification that that non-specificity is the result of an intentional choice for it, rather than an inherent Gini problem; and my mention of the Gini's obvious strong weighting of low-percentile incomes, which obviously means that the Gini _does_ say something about what's happening at a particular end of the distribution. (In addition to telling an obvious reason for that weighting, I'll also refer to a place in the Wikipedia Gini article that quotes a Gini-calculation-formula from a notable-source...a formula that clearly weights each household's income by its rank-number (larger for lower incomes) ).
Incidentally, of course all the indices that attempt to summarize the whole overall inequality have some weighting of the incomes of the different parts of the population, and changes in those incomes. There's no one right weighting. If there were a demonstrably right weighting of the importance of inequality between various population-segments, then it would make sense to use a number based on a that weighting of the inequalities. But, because there's no such right weighting of importances, then obviously it can't be meaningful, or make any sense, to give some aggregation-number based some weighting. To meaningfully tell about what's happening at both top and bottom, then it would be necessary to give separate numbers for those different facts. — Preceding unsigned comment added by 71.84.136.105 (talk) 18:19, 29 October 2020 (UTC)
Gini index other uses
Professor @Limit-theorem:, I see you deleted my contribution under other uses of the Gini index with the following comment Does not seem relevant or well spread a method. I can see that you have a solid mathematical/statistical background, so I wanted to make a case for my changes, in which the Gini-type coefficient was introduced in reliability theory. As you can see in FIGURE1 conceptually it is very similar to the original Gini coefficient but has a totally different application. Also, the Gini index has now far more application than just in economics. After its introduction in that paper, the Gini-type coefficient received multiple applications. This link is for proceedings from the last Annual Reliability and Maintainability Symposium in May 2021; The applications include but are not limited to:
- M. Parsa, A. Di Crescenzo, and H. Jabbari, On Gini−type index applications in reliability analysis, Reliability Theory and its Applications, Mashhad, Iran, 2017.
- M. Parsa, A. Di Crescenzo, H Jabbari, Analysis of reliability systems via Gini−type index, European Journal of Operational Research, pp. 340 – 353, 2018
- N.L. Johnson & S. Kotz. A vector multivariate hazard rate. Journal of Multivariate Analysis, 5, 53–66, 1975.
- A. Păun, C. Chandler, C.B. Leangsuksun, M. Păun. A failure index for HPC applications, Journal of Parallel and Distrib. Comput., Elsevier, 2016.
- M. Kaminskiy, Gini−Type Index for Aging/Rejuvenating Populations, arXiv preprint, arXiv:1408.2724, 2014.
It would be remiss if this fundamental application of the Gini Coefficient is not included in the Wiki article. Where else do you think it should be added if not under other uses? Sarouk7 (talk) 13:37, 11 July 2021 (UTC)
- Dear editor, thank you for your kind effort. Please note that these papers have no impact, the most cited appears to have 9 citations on Google Scholar, the other one has 4. This is not encyclopedia level. As to the "Parsa, Motahareh, Antonio Di Crescenzo, and Hadi Jabbari Nooghabi. "Comparison of Systems Ageing Properties by Gini-type Index." 13th Iranian Statistics Conference. 2016.", it has no citations. Limit-theorem (talk) 18:07, 11 July 2021 (UTC)
- @Limit-theorem: the paper is not widely cited as it was published by reliability practitioners, not academics. Also, the reliability field itself is fairly new and doesn't have a lot of research papers, and that's the reason I haven't created a new article just for that. On the other hand, one of the other uses mentioned: "Employing the Gini coefficient to measure participation inequality in treatment-focused Digital Health Social Networks" has 18 citations, and there was no problem adding it. As an academic, I believe you are a professor, do you usually look up citations only, or do you usually read the papers as well to judge them? Sarouk7 (talk) 21:28, 11 July 2021 (UTC)
- Look up WP:OR. Thanks. Limit-theorem (talk) 01:54, 12 July 2021 (UTC)
- @Limit-theorem:, one of the two sources I cited was published in peer-reviewed journals and was presented at the Annual Reliability and Maintainability Symposium 2021, and the original paper where the Gini-type coefficient was introduced was published as a chapter in a Springer's book Kaminskiy, M.P.; Krivtsov, V.V. (2011). "A Gini-Type Index for Aging/Rejuvenating Objects". Mathematical and Statistical Models and Methods in Reliability. Birkhäuser Boston: Springer. p. 133-140. ISBN 978-0-8176-4970-8., which has 32 citations. Isn't that sufficient? Sarouk7 (talk) 15:07, 12 July 2021 (UTC)
- Look up WP:OR. Thanks. Limit-theorem (talk) 01:54, 12 July 2021 (UTC)
- @Limit-theorem: the paper is not widely cited as it was published by reliability practitioners, not academics. Also, the reliability field itself is fairly new and doesn't have a lot of research papers, and that's the reason I haven't created a new article just for that. On the other hand, one of the other uses mentioned: "Employing the Gini coefficient to measure participation inequality in treatment-focused Digital Health Social Networks" has 18 citations, and there was no problem adding it. As an academic, I believe you are a professor, do you usually look up citations only, or do you usually read the papers as well to judge them? Sarouk7 (talk) 21:28, 11 July 2021 (UTC)
- @Sarouk7 That's very very low impact, locally and overall.Limit-theorem (talk) 17:47, 12 July 2021 (UTC)
- @Limit-theorem:, That's your personal opinion based on your knowledge on the subject. I don't agree with that. Even though using the Gini index in reliability application doesn't have a huge impact, it's still worthy of being mentioned, that's the reason I mentioned it under other uses and didn't create its own article. Looking at most of the references supporting other uses: Ref 74 has only 27 citations, reference 78 has 3 citations, and reference 81 comes from medium.com which is described as Medium is a place to write, read, and connect. Is that your definition of peer-reviewed journals?? Sarouk7 (talk) 14:58, 17 July 2021 (UTC)
- @Limit-theorem:, I find it unreasonable that you un-did my edits again without responding to my last response. Please not that I filed an edit dispute and you can post your response to the dispute resolution noticeboard Sarouk7 (talk) 22:19, 23 July 2021 (UTC)
- @Limit-theorem:, my apologies for not informing you earlier of the dispute, I was under the impression you get automiaically notified until one of the volunteers brought it up.
- As I clearly explained previously, the Gini coefficient application in reliability theory was originally published as a chapter in Springer's book — a highly reputable publisher of scientific literature with a peer-review editorial board: Kaminskiy, M.P.; Krivtsov, V.V. (2011). "A Gini-Type Index for Aging/Rejuvenating Objects". Mathematical and Statistical Models and Methods in Reliability. Birkhäuser Boston: Springer. p. 133-140. ISBN 978-0-8176-4970-8., which has 32 citations! In this respect, I don't understand your claim "every single low-impact paper unpublished or in no-impact journals".
- Furthermore, the use of Gini coefficient was published in Kaminskiy, M.P. (2013) Reliability Models for Engineers and Scientists (1st ed.). CRC Press, Taylor & Francis Group, London, doi.org/10.1201/b13701, ISBN ISBN-13: 978-1466565920. The book is indeed a textbook (as it has end-of-the-chapter exercises) and is used in educational courses at several universities. Sarouk7 (talk) 16:19, 24 July 2021 (UTC)
- That paper has 9 citations in 11 years. Limit-theorem (talk) 17:01, 24 July 2021 (UTC)
- Ref 74 has 27 citations in 16 years, reference 78 has 3 citations in 13 years, and reference 81 has no citation. How is that different? Again, that's the reason it's under other uses and not a standalone article. Sarouk7 (talk) 18:28, 24 July 2021 (UTC)
- I also found out that this specific use of Gini index in reliability is being taught at one of the graduate-level courses at the University of Maryland "ENRE640 Syllabus" (PDF).. That is far from being local and low impact. Sarouk7 (talk) 20:52, 24 July 2021 (UTC)
@Limit-theorem: I saw this listed at DRN, where I'm one of the founders of that noticeboard. I don't intend to take the case, but I am curious about this for my own edification. I'm unfamiliar with your use of citation count as a criterion for judging reliability of academic articles for Wikipedia purposes. Could you please point me to a Wikipedia policy or guideline or Reliable Sources Noticeboard discussion where that standard was adopted by the community? I've never encountered this assertion befor and if such exists, I need to know about it so that I can take it into consideration when doing dispute resolution. Regards, TransporterMan (TALK) 17:25, 31 July 2021 (UTC) Clarification: I neglected to say that I realize that at WP:SCHOLARSHIP that appearance in citation indexes is recognized as a sign of reliability/unreliability (particularly of the journal in which the article appears), but I see nothing there that says that comparison of the number of citations is a criteria. Regards, TransporterMan (TALK) 17:34, 31 July 2021 (UTC)
- Dear @TransporterMan:, in academia, the quality of one's research and acceptance by the scientific community, in general. correlates to the number of citations. Accordingly GS citations around a paper or topic or, more centrally author, are used as an indicator of solidity. The journal quality is sort of subsumed into it since journals are ranked by their "impact factor" which is a direct function of the number of citations. Limit-theorem (talk) 19:01, 31 July 2021 (UTC)
- I don't doubt that's the case, but that doesn't answer the question that I asked. Where does Wikipedia adopt that standard? Bringing in an outside standard such as that sounds a great deal like prohibited original research to determine what should and should not be in an article. Can you point me to such an adoption within Wikipedia? Regards, TransporterMan (TALK) 17:27, 1 August 2021 (UTC)
- Dear @TransporterMan:, in academia, the quality of one's research and acceptance by the scientific community, in general. correlates to the number of citations. Accordingly GS citations around a paper or topic or, more centrally author, are used as an indicator of solidity. The journal quality is sort of subsumed into it since journals are ranked by their "impact factor" which is a direct function of the number of citations. Limit-theorem (talk) 19:01, 31 July 2021 (UTC)
Dear @TransporterMan:, WP:RS: "Scientific information should be based on reliable published sources and should accurately reflect the current state of knowledge. Ideal sources for these articles include comprehensive reviews in independent, reliable published sources, such as reputable scientific journals, statements and reports from reputable expert bodies, widely recognized standard textbooks written by experts in a field, or standard handbooks and reference guides, and high-quality non-specialist publications."
In that sense for us in academia, citations are a good, perhaps the best, indicator of "reputability", that is, acceptance by the scientific community, though as we have learned, never by themselves as they are sometimes gamed by citation rings. Limit-theorem (talk) 21:25, 1 August 2021 (UTC)
- I've posed the question of citation count at RSN. See Wikipedia:Reliable sources/Noticeboard#Excluding academic sources due to relative infrequency of citations in citation indexes. Regards, TransporterMan (TALK) 19:24, 2 August 2021 (UTC)
@Limit-theorem:, That's contradicting!! You are saying Scientific information should be based on reliable published sources, and I proved that the application was published as a chapter in a Springer's book Kaminskiy, M.P.; Krivtsov, V.V. (2011). "A Gini-Type Index for Aging/Rejuvenating Objects". Mathematical and Statistical Models and Methods in Reliability. Birkhäuser Boston: Springer. p. 133-140. ISBN 978-0-8176-4970-8., which has 32 citations. On the other hand, most of the references supporting other uses: Ref 74 has only 27 citations, reference 78 has 3 citations, and reference 81 comes from a website that doesn't meet WP:RS --Sarouk7 (talk) 00:12, 3 August 2021 (UTC)
- A chapter in a Springer Book is not even considered peer-reviewed, only good supplementary material if the subject is well developed. We are trying to establish WP:RUW, whether there is undue weight to a use of Gini that is non-standard. Limit-theorem (talk) 12:50, 3 August 2021 (UTC)
- @Limit-theorem: Judging an article by the number of citations is extremely subjective, especially if it's a new and relatively small field such as reliability engineering; If a mathematics article receives 20, it might be a very good article. On the other hand, 20 citations to a biochemistry article may mean nothing. In some areas, people work many years to prepare a publication, and some others can publish a dozen papers per year. Therefore, judging the number of citations is unfair. I can see why some people refer to the citation number simply because of its simplicity; it's just a number that you can look at it and judge a book by its cover. However, the value of that approach seriously defeats its purpose. @MPants at work:
- In my opinion, the use of the Gini index in reliability engineering is an excellent utilization that extended its use from economics to reliability theory. Not only that work was published as a chapter in a Springer's book Kaminskiy, M.P.; Krivtsov, V.V. (2011). "A Gini-Type Index for Aging/Rejuvenating Objects". Mathematical and Statistical Models and Methods in Reliability. Birkhäuser Boston: Springer. p. 133-140. ISBN 978-0-8176-4970-8., but it was also reintroduced to the reliability society this year in the last Annual Reliability and Maintainability Symposium in May 2021, the publication can be found at This link. That should prove that the application has its weight as it resurfaced after 11 years of its first introduction. Also, the use of the Gini index in reliability is being taught at one of the graduate-level courses at the University of Maryland "ENRE640 Syllabus" (PDF).. That is far from being undue weight. --Sarouk7 (talk) 23:09, 3 August 2021 (UTC)
- A chapter in a Springer Book is not even considered peer-reviewed, only good supplementary material if the subject is well developed. We are trying to establish WP:RUW, whether there is undue weight to a use of Gini that is non-standard. Limit-theorem (talk) 12:50, 3 August 2021 (UTC)
@The Four Deuces:, would you please share your thoughts on this discussion above? --Sarouk7 (talk) 09:54, 4 August 2021 (UTC)
- Even if the Gini-Type Index for Aging/Rejuvenating Objects has received attention in reliable sources, you would have to show that it has received significant attention in the literature about the Gini coefficient. Dos Passos' trilogy U.S.A. in comparison has its own article but isn't mentioned in the article about the U.S.A. While one can navigate to the article about the book using links to disambiguation pages, the book is not important enough to the article about the country to have its own paragraph. The U.S. article would be unwieldy if we included everything that had U.S.A. or American in its name. TFD (talk) 11:04, 4 August 2021 (UTC)
- Wouldn't the presence at the Symposium and it's teaching in a graduate-level course meet that criteria? It seems like it to me. I would think that significant coverage in the reliability engineering literature would be sufficient to establish that this application of the Gini coefficient is notable and due.
- AFAIK, there's no field of study surrounding and focused on the Gini coefficient, so the literature about it would necessarily be whatever was published on the topic, and not, for example, whatever was published in the hypothetical Journal of Gini Coefficient Studies. ᛗᛁᛟᛚᚾᛁᚱPants Tell me all about it. 12:43, 4 August 2021 (UTC)
Problem with different distributions
The section on Continuous probability distribution includes a table giving the Gini coefficient for different distributions. I perceive problems with the formulae for some of these distributions, because G should go to 0 when the standard deviation goes to 0. This is NOT true for 3 of the 10 rows in the table:
Income Distribution function PDF(x) Gini Coefficient Consistent? Dirac delta function 0 yes Uniform distribution yes Exponential distribution Concern: standard deviation = . We can make that go to 0 by sending to . That should send G to 0. It doesn't. (This also makes the mean go to 0. If this were the only anomaly in this table, it might be OK. However, I'd still like to see a reference, preferably one that included a derivation of this value for G.) Log-normal distribution Yes: Pareto distribution yes as alpha goes to infinity Chi-squared distribution NO: variance = 2*k. This density function is not defined for k = 0, but you can make k arbitrarily small but positive. I don't have a proof, but if I've programmed G correctly, it goes to 1 for k small and positive. Gamma distribution NO: variance = . This G should go to 0 as goes to 0. It doesn't. Also, as for the chi-square, this density function is not defined for k = 0, but you can make k arbitrarily small but positive. I don't have a proof, but if I've programmed G correctly, it goes to 1 for k small and positive. Weibull distribution yes Beta distribution yes Log-logistic distribution yes


???DavidMCEddy (talk) 07:47, 17 August 2021 (UTC)
Please note that . is wrong.

as

.


Finally,

Sarouk7 (talk) 17:20, 22 August 2021 (UTC)
- @Sarouk7: Thanks for correcting my stupid error. We could still use a citation for the table. If we could get a derivation of G for the gamma distribution, that would also work for the exponential and chi-square distributions, because they are special cases of the gamma. DavidMCEddy (talk) 19:31, 22 August 2021 (UTC)
- DavidMCEddy, I will work on manually derive the G for the Gamma Dist., however, here's a link that could be used as a reference: https://www.jstor.org/stable/2286411.
- Please note that the paper is using different notation than the Wikipedia article:


- at the denominator

Are you sure that a standard deviation of zero implies a Gini coefficient of zero for a continuous probability distribution, or is it an intuition? I think it is true, and a good intuition, for a discrete probability distribution with a finite number of points, but I get suspicious when integrals blindly replace sums, and infinity blindly replaces "the maximum number" when going from finite discrete to infinite discrete, to continuous. I'm not saying you are wrong, I'm just saying a proof of your statement would probably clarify where the problem is. Investigating the particular case of the simple exponential distribution might reveal the problem. PAR (talk) 08:22, 29 August 2021 (UTC)
- I'm not sure: For both the gamma and exponential distributions, the mean goes to 0 as the standard deviation does.
- The exponential distribution is a gamma distribution with k = 1, so we need only consider the gamma distribution. For that, EX = , which var(X) = . This means that the mean goes to zero as the standard deviation does. The issue may be resolved in that article that User:Sarouk7 cited from Jstor. If so, that should be cited to justify the results for the gamma, exponential and chi-square distributions.
- I just added notes to for the log-normal entry in the table. It might be good to add that article that User:Sarouk7 cited from Jstor, but I wouldn't want to do it without looking at it, and I don't want to take the time now to do that.
- Thanks, DavidMCEddy (talk) 12:47, 29 August 2021 (UTC)

- A fundamental property of the Gini Coefficient, or any income inequality metric is scale invariance (See Income inequality metrics). For example, the Gini coefficient will be the same for a given set of incomes, whether those incomes are expressed in dollars, pennies, Euros, or whatever. If we have a probability distribution p(x,φ,a,b,c...) where φ is the scale factor then:

- Scale invariance means the Gini coefficient for p will be independent of φ. For example, the exponential distribution has only one parameter, which is the scale factor φ=1/λ:

- and so the Gini coefficient of the exponential distribution is a constant (1/2), independent of λ.
- The standard deviation of ANY distribution will depend linearly on the scale factor. For the exponential distribution the standard deviation is just φ = 1/λ, so that clearly, as the standard deviation tends to zero, the Gini coefficient does not. For ANY distribution, as the scale factor tends to zero, the standard deviation will tend to zero, and this will have no effect on the Gini coefficient, or any other inequality metric. PAR (talk) 05:50, 30 August 2021 (UTC)
- Thanks for this. However, I think we should be careful in the use of the term "scale factor": I'm used to thinking of an affine transformation as a change of scale, but that doesn't work here for what you are saying.
- You're saying that if the mean is proportional to the standard deviation, the Gini coefficient is unchanged by any change in the standard deviation, even when it goes to 0?
- That sounds plausible. Do you have a reference that says that?
- I just search for the word "scale" in this article, and didn't find where it says that. I think it could be very useful in helping people understand what happens.
- We might include a discussion of the uniform distribution for which considering as a scale factor. The standard deviation is , and . Then as the standard deviation goes to 0, doesn't change. However, if the standard deviation goes to 0 with bounded away from 0, goes to 0.
- Similarly, with the log-normal distribution, as , but the median is unchanged.
- Thanks, DavidMCEddy (talk) 08:02, 30 August 2021 (UTC)


- I'm just using scale factor the way I've seen it used in the context of probability distributions. I'm more concerned with the behavior of it, we can call it whatever we want. I think your example of the uniform distribution is an excellent and intuitive example of a distribution that is a function of more than just the scale factor, (like the exponential distribution is), and it also points out that what I wrote above is incomplete. I wrote:
- and that is true only if the a,b,c are dimensionless. The Wikipedia uniform distribution is U(x,a,b) where x, a and b have dimensions of dollars or whatever. Your development is U(x,a,c) where a is the scale factor (dimensioned) and c=b/a is dimensionless, so the above equation holds.

- and the Gini Coefficient is a function of only the dimensionless c as you wrote above.

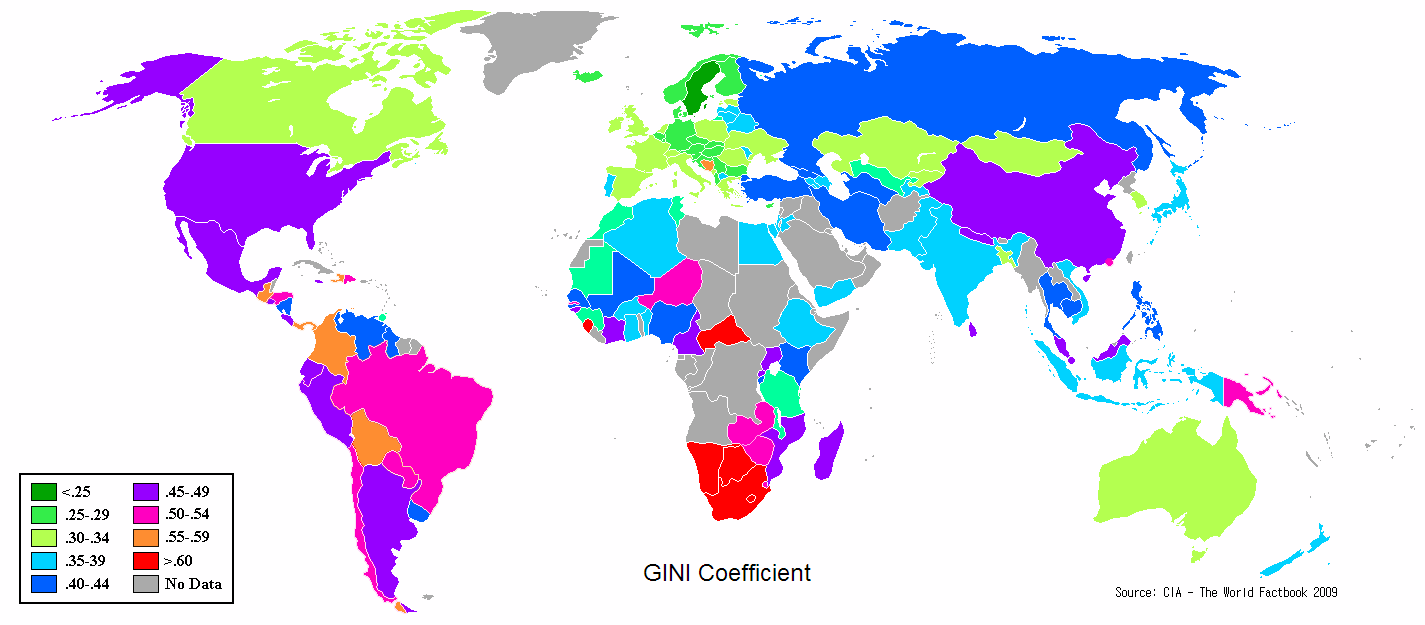
- I think for any distribution p(x,φ,a,b,c...), the Gini coefficient will be a function of only the dimensionless a,b,c....
- You said "You're saying that if the mean is proportional to the standard deviation, the Gini coefficient is unchanged by any change in the standard deviation, even when it goes to 0?". I don't think I'm saying that, I'm saying that if Gini goes to zero, SD goes to zero, but not vice versa. Looking at your equations for the uniform Gini and SD, that is seen to be true. I don't have any references for this stuff at present, its just trying to follow the logic. I think these considerations would be good to add to the article, in which case references would be necessary. PAR (talk) 00:19, 31 August 2021 (UTC)
- Thanks. Might you have time and interest to review the article suggested by User:Sarouk7:
- "https://www.jstor.org/stable/2286411"?
- Might you have access to this article? If no, have you considered Wikipedia:The Wikipedia Library? I don't know their requirements, but Wikimedians with any substantive history should be able to get access to JSTOR through them, I think.
- I'm overwhelmed with other commitments and not eager to review this article at the moment. If someone else can, that would be great. It may answer the questions at hand ... or maybe not. DavidMCEddy (talk) 01:45, 31 August 2021 (UTC)
- The source mentioned by Sarouk7 is an excellent source for Gini, Theil, and Pietra measures using the Gamma distribution, showing their derivation as well. It goes into the statistical analysis for generating Gamma parameters from a finite dataset. I've added it as a source for the Gamma function on the table, as well as a small discussion of scale invariance in the same section.PAR (talk) 06:46, 31 August 2021 (UTC)